


Nasdaq New Lows Spike
Free Chart In Focus email
Delivered to you every week
The post-election worries about new government policy on AI and data centers helped to feed an already worried investment community, and an already downward correction in the Nasdaq Composite Index. Most of the damage has been in the big data and chip stocks, and indeed on Nov. 5 there were 10 members of the Nasdaq 100 which closed down by more than 15%.
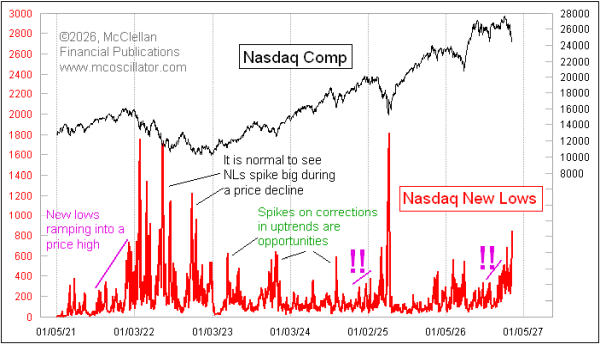
This week's chart shows one of the extreme bits of data behavior accompanying this dip. The number of Nasdaq market stocks making new 52-week lows spiked up to 851, the highest since tariff worries of April 2025. Spikes like this during uptrends are good markers of an opportunity to buy at a discount. But the worry is that it is not just a correction in an uptrend. Much bigger spikes occurred during the 2022 bear market.
This spike up in Nasdaq New Lows comes after an interesting setup. The daily numbers of New Lows were starting to move higher even as the Nasdaq Comp was still making new higher highs. That was a warning sign of trouble, and this newest spike in New Lows marks the fulfillment of that warning. It should be worth at least a meaningful bounce, even if we are transitioning into a full-fledged bear market (which I do not believe we are).
We make available historical data on New Highs and New Lows for both the NYSE and the Nasdaq here: https://www.mcoscillator.com/subscriptions/signup/historical-data/. An important point to understand about those data is that they only go back to 1980. Other data on NH and NL exist before 1980, but they are not comparable.
It used to be that the statisticians who kept track of these data used paper ledgers, one for each stock every year. When a new calendar year started, they would start a new ledger for that year for each stock. This created a problem for tabulating data for all the stocks on the exchange, because every stock would be counted as making both a New High and a New Low on January 2. So they would carry over the record prices from the prior year's ledger for a while into the new year. Then around April, they would switch to just using the new year's ledger. As a result, the lookback period was anywhere from 4 to 16 months.
By 1980, there was finally enough computing power to transition away from paper ledgers, and to switch to a more uniform 52-week lookback period which remains the standard. Statistics on NH and NL are tabulated based on intraday extremes, which can occasionally make for some strange anomalies. On Oct. 10, 2008, the Nasdaq Comp actually closed up on the day, but saw a big intraday dip resulting in 1514 Nasdaq stocks making New Lows that day. That same day, the NYSE made an all-time record with 2901 stocks making New Lows.
In my Daily Edition for Nov. 5, 2026, I shared several other extreme data readings resulting from the post-election reactions in stocks. The VIX Index closed above all of its futures. The VXN Index (volatility for the Nasdaq 100) reached 38.26. Volume in QQQ was the highest since the April 2025 tariff worries, which is a sign of climactic trader worry and a marker of a price bottom. You can find out more about subscribing to the Daily Edition at https://www.mcoscillator.com/market_reports/.
Tom McClellan
Editor, The McClellan Market Report
May 02, 2025
New Lows Spike Was Unusual This Time |
Jan 30, 2025
Rising New Lows In The Nasdaq |
Sep 28, 2012
NYSE New Highs Data Say Uptrend Not Done Yet |