New Lows Spike Was Unusual This Time

Free Chart In Focus email
Delivered to you every week
The price low on April 8, 2025 was unusual because it coincided with the highest reading for stocks making a new 52-week low on the NYSE. Usually the number of New Lows peaks before the final price low.
One point that is important to understand about the data for New Highs and New Lows is that the calculations employ intraday extremes. And so even though the SP500 closed higher on April 9, it only did so after making a lower intraday low, which helped a lot of stocks push down to their own new 52-week lows. But this is still a coincident event compared to other important stock market lows over the past 5 years shown in this chart. Usually the highest reading for NYSE New Lows occurs several days ahead of the final price low. So that is a missing component thus far for this current price decline. It casts some doubt on the presumption that "the bottom is in".
As an interesting side note, the calculation methods for determining the numbers of New Highs and New Lows underwent a change in 1980, so data before then is not directly comparable to afterward. It used to be that all of the statistics on these data were kept by hand, on ledgers, and the clerks keeping these data would keep separate ledgers for each calendar year. That made sense on one hand, to have the annual price records, but when tabulating the overall numbers for the market, it created a problem each January, when the new ledgers would be started.
So what the clerks did was that for the first few weeks of every year, they would incorporate the pricing records from the prior year for a while. Then sometime around April they would switch to only using the current year's ledgers. So the lookback period for the calculations of New Highs and New Lows would range from 4 to 16 months. The advent of computers made it easier to employ a uniform 52-week lookback period, which was implemented in 1980. Some data exist for the New Highs and New Lows before then, but they do not behave the same as the post-1980 data with the more uniform lookback.
If you would like to have access to the post-1980 data on NH and NL for both the NYSE and the Nasdaq, you can order that here: https://www.mcoscillator.com/subscriptions/signup/historical-data/
Tom McClellan
Editor, The McClellan Market Report
Jan 30, 2025
Rising New Lows In The Nasdaq |
Oct 11, 2013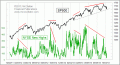
New Highs’ Divergence |
Sep 28, 2012
NYSE New Highs Data Say Uptrend Not Done Yet |