Liquidity Is Not The Problem

Free Chart In Focus email
Delivered to you every week
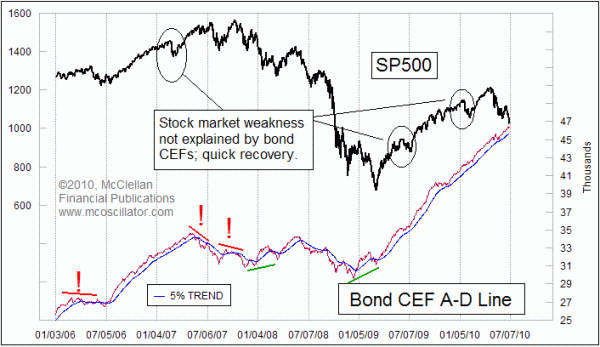
Since the April top, things have been pretty ugly for most of the stock market. But one segment of the market is holding up really well, and that is the bond related closed end funds (CEFs) that are traded like stocks on the NYSE.
These issues are often maligned for supposedly making a disruptive contribution to breadth statistics, contaminating a pool of otherwise pure common stocks. They are criticized by many technical analysts for this disruption, but what most people do not know is that these issues are perhaps the best indicators of liquidity one can find.
When money is plentiful, these bond CEFs do well. But they start to suffer the soonest when liquidity begins to dry up. So if the rest of the market looks fine but the bond CEFs are doing poorly, it is time to worry. Similarly, if the major stock market averages are looking bad but the bond CEFs are holding up okay, then it is not a liquidity problem that is upsetting the stock market.
That is the situation we face right now. The SP500 is down 16% from its April 23 top, but the Bond CEF A-D Line is at a new all-time high. As the chart illustration points out, instances of a decline in the SP500 that is not matched by a decline in the Bond CEF A-D Line tend to be temporary stumbles for stocks caused by worry and not caused by illiquidity, and so the stock market is able to quickly recover.
It will be time to really worry when we see the Bond CEF A-D Line make a top and head downward while stocks continue higher. We are not seeing that now, but we did see it back in 2007. The Bond CEF A-D Line reached its top on May 11, 2007, more than 5 months before the top in the SP500 later that year.
Tom McClellan
Editor, The McClellan Market Report
Mar 05, 2010
NYSE’s New Highs Confirm Uptrend |
Jan 01, 2010
Nasdaq A-D Line “Divergence” |
Oct 30, 2009
A-D Line Back Near All-Time Highs |
Oct 16, 2009
A-D Line Has the Story on Corporate Profits |