U.S. Nearly Alone In Making New Price Highs

Free Chart In Focus email
Delivered to you every week
The Federal Reserve's program of buying $85 billion per month of bonds and related debt instruments is assuredly helping to keep the U.S. stock market aloft, and at a time when my longer term models have been saying we are due for a liquidity crunch. But other countries' stock markets are not joining in the incremental new highs we have just seen in the DJIA and SP500. I thought this would be a good time to take a look at what the rest of the world has been doing.
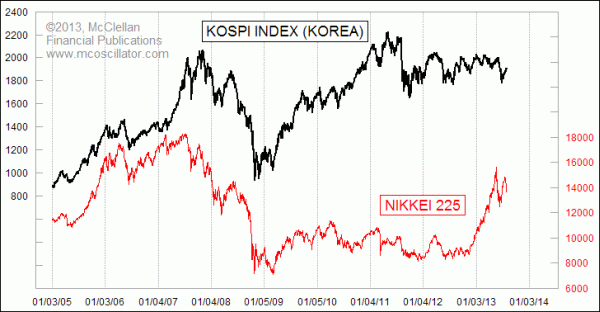
The lead chart above looks at the Japanese and South Korean indices. Japan saw a big boost to its stock market in sync with the drop in the yen earlier this year, after Prime Minister Abe took office. But both the Nikkei and the Kospi are now making lower highs.
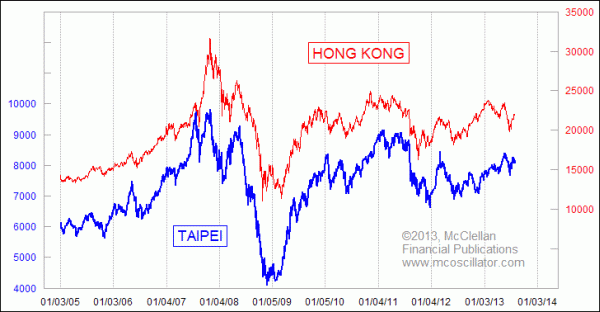
Elsewhere in Asia, the Taiwan Stock Exchange Weighted Index in Taipei and the Hang Seng Index in Hong Kong are still both below their May 2013 highs.
And Hong Kong is still down below its level in January 2013.

China's Shanghai B, Singapore's Strait Times Index, Toronto's TSX, and Australia's All Ordinaries Index (not shown) are also below their May highs, and not confirming the show of strength in the U.S.
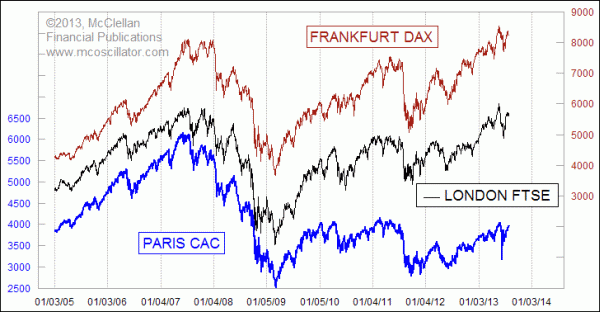
The same situation exists in the major European markets:

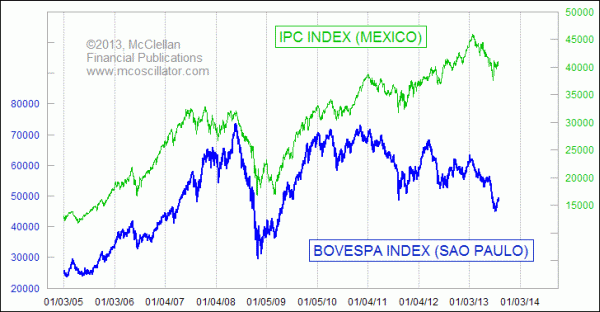
Latin America is no different:

Mexico's stock market had been looking really strong into its January 2013 top, but has turned really weak since then. And the Bovespa Index in Brazil made a new 4-year low just a few weeks ago. It continues to be in a downtrend which dates back to its 2010 top.
So the point is that the rest of the world's markets are not feeling the benefits of the Fed's helicopters dropping money every month. They are suffering from the illiquidity problems which were scheduled for this year, again according to my long term indicators.
The question for U.S. investors is this: Will that $85 billion per month be enough to continue fighting off the swirling vortex of illiquidity that is pulling the rest of the world down?
Tom McClellan
Editor, The McClellan Market Report
Mar 15, 2013
Canada, Mexico, and Oil Prices |
Jul 27, 2012
The Real Cause of Higher Grain Prices |
Dec 16, 2011
Baltic Dry Disputes China Collapse |