Canada, Mexico, and Oil Prices
Free Chart In Focus email
Delivered to you every week
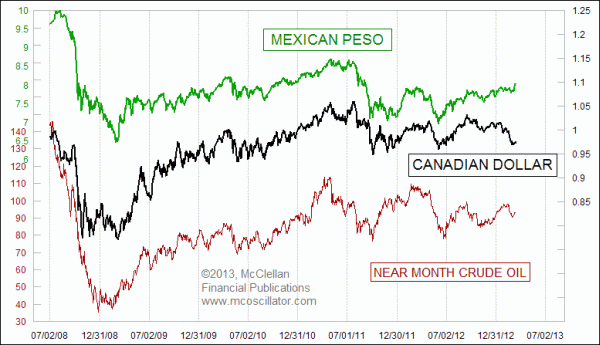
One of the more interesting intermarket relationships these days is the strong correlation we see between crude oil prices and both the Canadian dollar and Mexican peso. That correlation makes some sense, since each of those countries is a major oil exporter, and so the fortunes if their economies and thus their currencies are linked to what the price of oil does.
Right now, it is even more interesting, because of the mixed message we are seeing in the chart above. Most of the time, all three lines in this chart dance together, like birds flying in formation. But if you look closely at the most recent data, there is a big disagreement between the Mexican peso and the Canadian dollar about where the group is headed. The peso has swooped up to a multi-month high, while the Canadian dollar has turned downward and appears poised to drop to a multi-year low.
For its part, the price of crude oil seems to be taking more of a middle of the road path, not wanting to go along with either currency, but rather it is seemingly taking a compromise position in the middle of its price range of the past 2 years.
So with such a disagreement, who is right? Unfortunately, history shows that neither currency has a better track record of being "right" when they disagree. Unlike the case I wrote about last week, where GE's share price seems to know better than the Dow where both are headed, it does not work that way for these two currencies. One can find plenty of instances in history to justify either argument about which one tends to be "right".
Making this situation all the more interesting now is the situation we see in the Commitment of Traders (COT) Report data. For years, I have used the COT data on both the Canadian dollar and the Mexican peso as surrogate sentiment indicators for crude oil. The COT data for crude oil futures themselves can sometimes convey confusing messages, so having other sources to turn to is a useful way to get perhaps cleaner insights.
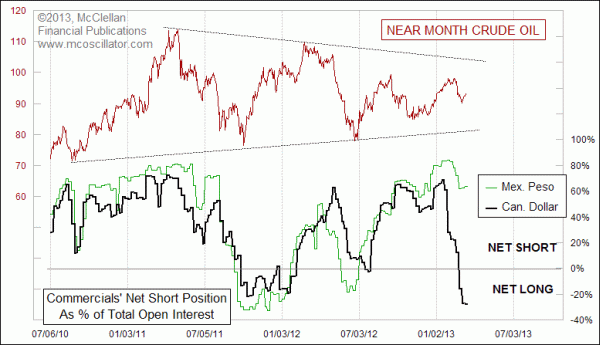
From each currency's perspective on its own, the COT data make sense. With the peso up at a new multi-month high, commercial traders are holding onto a big net short position. And with the Canadian dollar falling to a multi-month low, commercial traders are betting that the Canadian dollar will rebound. They are now net long the Canadian dollar futures to an even greater degree than what we saw when both oil prices and the Canadian dollar put in price lows back in 2011.
So if the relationship of oil prices to these currencies is going to continue being well correlated in the future as it has been in the past, then the two currencies cannot both be right about where they are headed. Something is going to have to break, and somebody is likely to be proven "wrong".
Even looking at the "cross rate" between the Peso and the Canadian dollar does not help us much about figuring out where oil is going.
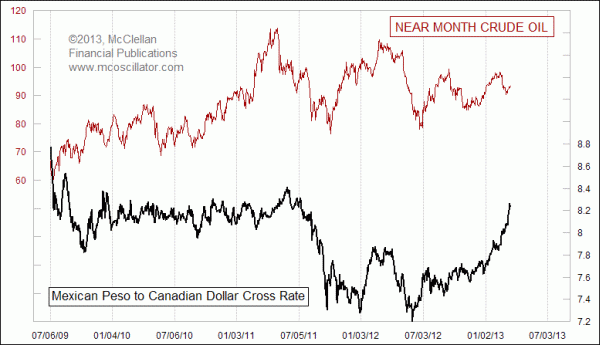
We can see when looking at that cross rate that its turning points sometimes mark tops for oil prices, sometimes bottoms, and sometimes neither. Sometimes the charts just don't give us the answers that we want them to give. But if we are open minded, then perhaps we can find answers to questions we were not even asking.
Perhaps the best point to take from this strange and divergent behavior between these two currencies is that perhaps we are nearing a point when it ought to reverse. That would mean the steep swoop upward in that cross rate could turn around, and history shows that such a reversal could be a sharp one. To take advantage of that potential reversal, a currency trader would have to short the peso and go long the Canadian dollar, but that is a sophisticated trade that is difficult to put on and to manage in case the position suddenly goes against you. I never recommend any trades to anyone, because I have no way of evaluating what a person's risk tolerance and trade suitability may be. But some traders may be set up to handle it, and to make that decision for themselves.
As for oil itself, that potential currency turmoil could mark the start of a move that takes oil up or down out of its sideways structure. So we can prepare for a trending move, and to plan on figuring out as it happens which direction that trend is going.
Tom McClellan
Editor, The McClellan Market Report
Nov 11, 2011
Borrowing An Indicator |
Feb 28, 2013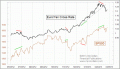
The Euro/Yen Cross Rate |
Mar 08, 2013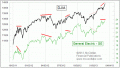
GE says Dow’s New High is Suspect |