60-year Cycle In Interest Rates

Free Chart In Focus email
Delivered to you every week
The Baby Boom started in 1946, and continued through 1964. Boomers saw their first instance of a financial bubble in the 1970s when gold was finally released from its permanent fix to the dollar, and was allowed to float. It went from $42 to $900 in a decade, then collapsed throughout the 1980s.
After the gold bubble of the 1970s, Boomers and others swore they would never get caught up in another bubble in something as frivolous as gold. No, no, from now on they would only invest in things that actually had earnings, like technology stocks.
After the Internet bubble hit its peak in 2000, Boomers swore they would never invest in something ephemeral like Internet stocks. From now on, they would stick to something safe, something real, like real estate.
And now, after the 2007 peak of the real estate bubble led to a collapse of the stock market and a deep economic slowdown, Boomers are again making resolutions to never again get caught up in something so speculative. No, no, from now on, Boomers are deciding to stick to something safe, something like bonds. After all, people are supposed to invest more in bonds when they get older, aren't they?
The problem is that the Baby Boomers are such a large group that whenever they all try to crowd into the same room, their combined weight is more than can be balanced by the rest of the investing public. So having Boomers all decide that bonds are the place to be creates some interesting disruptions in the financial markets.
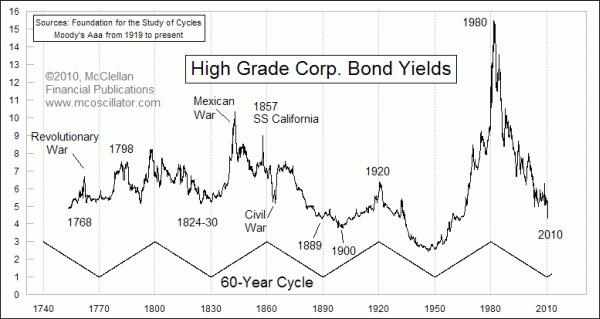
And this new investing fashion that has Boomers piling into bonds arrives just as interest rates are nearing the bottom of the 60-year cycle in interest rates. One important point to remember is that bond yields move inversely compared to bond prices. So seeing bond yields fall like this is another way of saying that bond prices are rising.
This week's chart looks at the history of high grade corporate bond yields, which date back as far as 1768 in the data set previously compiled by the Foundation for the Study of Cycles (FSC). Since 1919, Moody's has been tracking the average yields on various categories of corporate bonds, so the older yield data has been stitched together with Moody's more modern data. Going back to periods before 1919 is a bit more problematic, since the data are harder to access and since definitions of things like "stocks" and "bonds" were somewhat looser in the 1800s than what we think of today.
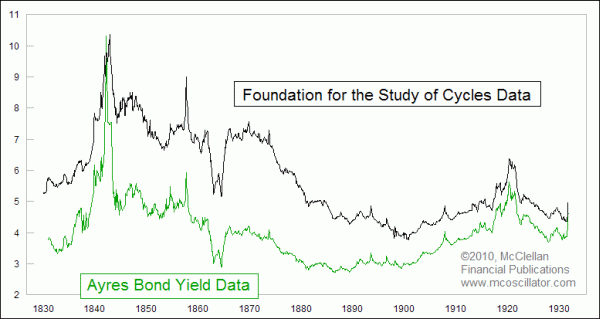
To verify the validity of the FSC data, it is useful to compare it to another set of data. In his 1940 book, "Turning Points in Business Cycles", Leonard Ayres compiled a set of high grade corporate bond data going back to 1831. Ayres is perhaps better known as the guy who first thought it might be useful to compile data on advancing and declining issues while he was working for the Cleveland Trust Company in the 1920s. He also gained notoriety working as a senior logistics officer for General John J. "Blackjack" Pershing during World War I.
The chart below compares the Ayres data to the FSC data. The absolute values are somewhat different throughout the 1800s, likely owing to the fact that the two sets of data were compiled from the histories of different yield-producing products. But the values get closer together as we get to the 1900s.

The important point for us to note today is that the up and down movements of the two plots is very similar. In other words, each data set shows the same cyclicality in terms of the direction of interest rates, and this gives us greater statistical confidence in the cycles shown in the FSC data.
There are important bottoms for interest rates which can be seen near the decadal marks of 1770, 1830, 1890, and 1950. Each of these bottoms arrives approximately 60 years after the prior one. The next major bottom for interest rates is ideally due in 2010, plus or minus. This cycle expectation just happens to coincide with the arrival of Baby Boomers at an age when they figure they ought to load up on bonds, just to be safe. So once again, Boomers are all piling into another financial asset type at precisely the wrong time.
Tom McClellan
Editor, The McClellan Market Report
Feb 12, 2010
Birth Rate and the Stock Market |
Apr 23, 2010
Home Prices and the Birth Rate |
Sep 11, 2009
Is a Higher Savings Rate a GOOD Thing? |
Dec 11, 2009
Final Dip Coming For Housing Market |