


7-Year Cycle in Margin Debt
Free Chart In Focus email
Delivered to you every week
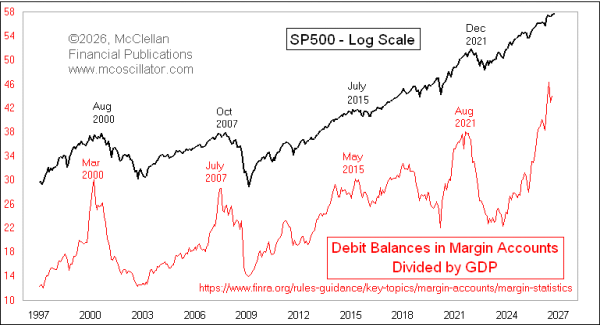
The total amount of margin debt has been screaming higher, a factor which has drawn a lot of attention. High margin debt has been present at major market price tops in the past. But there is more to this relationship than just the overbought indication.
Lars Von Thienen of the Foundation for the Study of Cycles recently filmed a great video, available at www.youtube.com/watch?v=lic-00cjI40, where he looks at the cycles implications of these data. He used cycle analysis software to detect a dominant 7-year cycle, which we have recreated in the top chart. Instead of looking at raw margin debt numbers, the chart above does what Lars did, and uses margin debt divided by GDP.
The cycles software Lars uses actually results in a period length of 81 months, and there is a half-period harmonic cycle of 43 months which also shows up.
I find that the 7-year period is the much more important cycle. If we presume that this cycle is going to continue, then that means the next top for margin debt and for the stock market is due in 2028. Lars also made an interesting observation, that margin debt to GDP usually peaks a few months before the final price high in the SP500.
The data Lars used are from FINRA, and it is monthly data that only goes back to 1997. I wanted to investigate whether this 7-year cycle is really durable by looking back farther in time.
So this next chart shows similar data published by the St. Louis Fed at its FRED web site. These data are greatly different in numerical value, and are only available quarterly, but they go back a lot further in time. What the actual differences are in terms of the ingredients of each data series might be an interesting question for the statisticians, but is not greatly relevant for examining the cyclical phenomenon, which does show up in both data series.
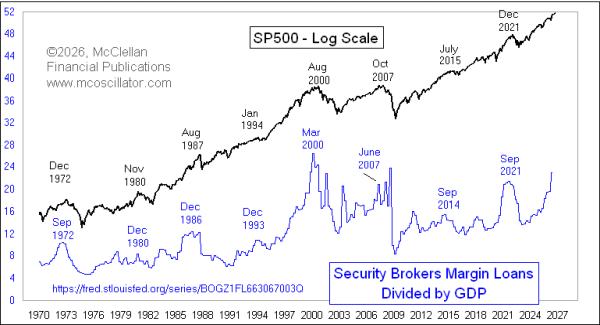
There is an unusual anomaly in the FRED data in the lower chart in late 2008, an upward spike which does not match the other data, nor does it match what the stock market was doing. That was when Lehman Brothers was blowing up, so the data got a little bit screwy. Other than that, the 7-year cycle does show up going back several more iterations, and also manifesting (mostly) the trait of seeing margin debt to GDP peak before prices. The quarterly data are a bit less precise on that measurement.
The key takeaway is that, yes, margin debt is high now even as a percentage of GDP. But the very strong 7-year cycle is not due to top out until sometime in 2028, so the bull market is more likely to live on, and get to an even more extreme condition before it is finished.
Tom McClellan
Editor, The McClellan Market Report
Jan 06, 2017
Debt or DJIA: Who Gets to 20* First? |
Sep 24, 2026
RASI Shows Depth of Correction |
Aug 07, 2026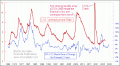
Employment and Inflation: The Real Relationship |