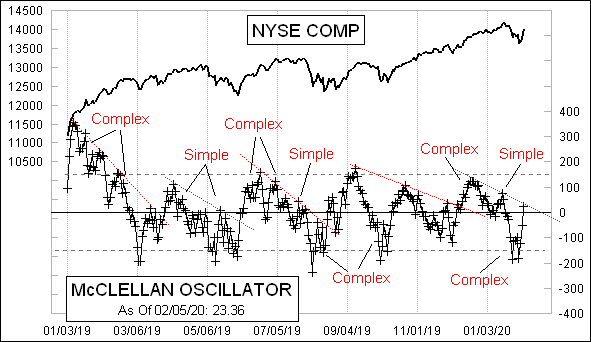
Choppy or Simple Structures in McClellan Oscillator
Free Chart In Focus email
Delivered to you every week
The McClellan Oscillator value on Feb. 5, 2020 was +23.36. Taken all by itself, that is not a very useful piece of information. Yes, it is above zero, meaning slightly positive recent acceleration upward in the Advance-Decline data on the NYSE. But if you only know the number and nothing else, you miss out on important context.
The number by itself does not tell you anything about the recent trend in Oscillator values. When Sherman and Marian McClellan wrote their book, Patterns For Profit, in 1970, they called it that for a reason. Understanding the patterns in the Oscillator’s behavior is key to properly interpreting its message.
This week, I want to focus on one aspect of Oscillator patterns, relating to whether there are “complex” structures or “simple” ones. A complex structure is one which involves chopping up and down without a crossing of the zero line. Complexity implies strength for the side of zero on which it is seen. So a complex structure below zero conveys a message that the bears are the ones in charge. There can still be a brief rally, even one that takes the Oscillator above zero, but the bears are still presumed to be in charge.
That message can be relieved in one of two ways. First, the Oscillator can pop up briefly above zero and then go back down, leaving just a simple structure on the dip below zero. Or second, the Oscillator can start building a complex structure above zero. Neither of those has happened yet as of this writing.
When there is a simple structure, like the most recent move above the zero line, the message is of a lack of authority for that side. So even though we are seeing new all-time price highs on some of the major averages, the Oscillator is saying that there are still problems with the bulls’ case.
There is one more relevant item in this week’s chart which is worth discussing, and that is the downtrend line across the recent Oscillator highs. The current pop up above the zero line came up just to that line, but not through it. If the pop fails here and turns the Oscillator back down again, that would amplify the message that the bears are still in charge.
When an Oscillator downtrend line like this gets broken, that can be an important message that a new uptrend phase is getting started. The more organized the Oscillator readings are on that trendline, the more important the message is of its breaking.
Tom McClellan
Editor, The McClellan Market Report
Aug 01, 2019
Quiet McClellan Oscillator is a Tell For a Top |
Feb 14, 2019
50 Years Since Creation of the McClellan Oscillator |
Mar 10, 2016
Highest McClellan Oscillator in 7 Years |