Lead Prices Foretell CPI Changes

Free Chart In Focus email
Delivered to you every week
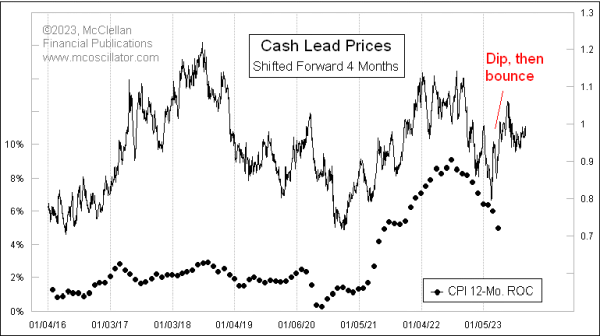
Inflation rates have been coming back down from their big post-Covid spike to above 8%. But they are likely to see a brief upturn, if this week's guest fortune-teller is correct.
The movements of the price of lead tend to get repeated about 4 months later in the Consumer Price Index (CPI). That is the message in this week's chart. Lead is an industrial metal which most of us do not think about now that it has been taken out of gasoline, but it still finds uses in lead-acid car batteries, car radiators, and in some electronics components. Its price goes up and down with demand, like lots of other industrial metals, and it does a pretty good job of foretelling the movements of other prices.
This is relevant right now because lead prices bottomed on September 27, 2022 and spiked up to a top on December 30, 2022. We have not yet seen the CPI reflect that upswing in lead prices, and we ought to see some echo of it over the next 1-2 months. That up move in lead prices in late 2022 did not go very far nor for very long, but it was still a noticeable up move that ought to see its echo get felt in consumer prices. Note that in the chart above, I have shifted forward the plot of lead prices in order to allow us to better see how the CPI data echo lead's movements after that amount of lag time.
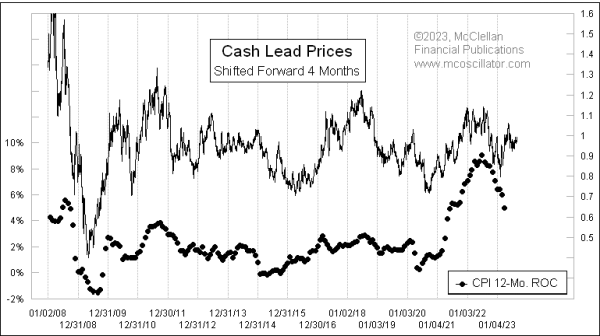
This is not a new phenomenon; it has been going on for years. Here is a longer term chart going back to 2008, again with the 4-month offset employed.

The movements of the CPI rate of change do not perfectly echo all of lead's price movements. And this is daily pricing for spot lead versus monthly data for the CPI, and so the lead price plot understandably has more noise.
Why this particular lag time is 4 months is a fascinating question, but not a very useful one. A person does not need to have an answer for that question in order to take advantage of the insights that this comparison offers us. If a phenomenon has been going on consistently for long enough, we do not have to be able to perfectly explain it in order to notice it and use it. It is also worth noting that the magnitudes of lead's price movements do not always get perfectly replicated in the CPI data. I am not bothered by that, because I find that if I get the direction and the timing of the turns correct, the magnitudes can take care of themselves.
Look for the CPI to make a bit of an inflationary resurgence over the next 1-3 months, and for the Fed and others to get a bit excited about that. But also know that it should just be a temporary resurgence.
Tom McClellan
Editor, The McClellan Market Report
Nov 22, 2019
Squeeze Is Building in Industrial Metals |
Mar 24, 2023
Baltic Dry Index As Leading Indication |
Oct 28, 2022
Timing the Start of a Recession |