M2’s Slow Growth Creates Opportunity in Bonds

Free Chart In Focus email
Delivered to you every week
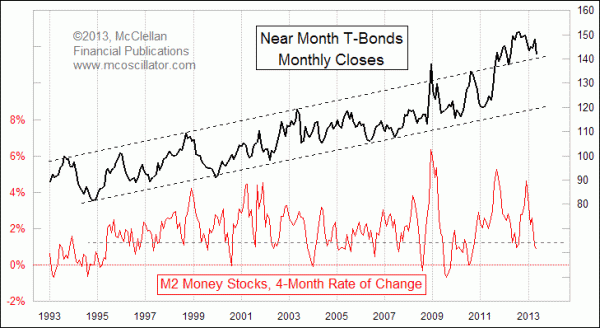
The Federal Reserve may still be printing a bunch of money to buy up $85 billion of Treasury and mortgage debt each month, but it is not having a very big effect on the growth rate of M2. Over the past 4 months, M2 is up by less than 1%, and it turns out that this fact is a meaningful one for bond prices.
I have looked at various periods for a rate of change (ROC) indicator on M2, and find that 4 months is an interesting one. 3 months might make more sense, since it is one calendar quarter, but 4 months seems to be more interesting.
In this week's chart, I compare that 4-month ROC of M2 to a monthly plot of T-Bond futures prices. It is interesting how good the correlation is, and the conclusion from that is that surging money supply seems to end up causing bond prices to rise. All of that extra money has to go somewhere.
Back in the 1980s, stock market traders used to gather around the Reuters or Telerate terminals once a month to watch the latest numbers come in for M1 and M2. There was some correlation to stock prices, although never as much as was widely believed, and that practice of watching for the monthly number fell out of favor when traders gradually realized that the correlation did not seem to be working as well as they thought. We are not seeing the same sort of behavior now among bond traders, waiting for every monthly M1 and M2 number to come out, perhaps because they don't know about this correlation (until reading this), or perhaps because there is so much other information out there for traders to consider.
What I find interesting is that a rapidly rising M2 growth rate is associated with rapidly rising bond prices. And once that growth rate tops out at a high level, bond prices typically drop back downward as the M2 growth rate decays back toward zero.
Also interesting is that when this 4-month ROC dips below about 1%, that tends to be followed by a period of rising bond prices. The last dip below 1% in 2012 did not work out so well, but others in the past have a reliable association with bond prices rising as the M2 growth starts coming back on again.
With T-Bond prices pulling back now to the top of the broken upper channel line, this information about M2 growth coming down now to a low level provides evidence to argue for higher bond prices in the months ahead.
Tom McClellan
Editor, The McClellan Market Report
Mar 23, 2012
SP500 Undervalued Versus M2 |
Aug 10, 2012
Open Interest Gives A “Tell” For T-Bonds |
Jun 29, 2012
Interest Rate Models Call For Lower Dollar |
Aug 27, 2010
60-year Cycle In Interest Rates |