Nasdaq Summation Index

Free Chart In Focus email
Delivered to you every week
When we talk about the McClellan Summation Index, we are usually referring to the version of it calculated on NYSE Advance-Decline (A-D) data. But it can be calculated on any type of breadth data. Whether such an alternative is useful is a separate question.
This week's chart looks at the Ratio-Adjusted McClellan A-D Summation Index for the Nasdaq. It is noteworthy right now because it has gotten down to a very low level, below -1000, and turned up. That can be a pretty nice bullish signal, although in a bear market like 2022 such an upturn at a low level does not necessarily bring fortune to the bulls. And indeed, seeing a signal like that fail is a powerful way to know that you are in a bear market.
The "Ratio-Adjusted" calculation means that we have adjusted the data to account for the changing numbers of issues traded over time. Doing this makes for more meaningful long term comparisons and evaluations, versus using the classic unadjusted version.
Looking at breadth data on the Nasdaq can be problematic, because there is an inherent negative bias. Here is a chart of the Nasdaq's daily cumulative A-D Line to show what I am talking about.
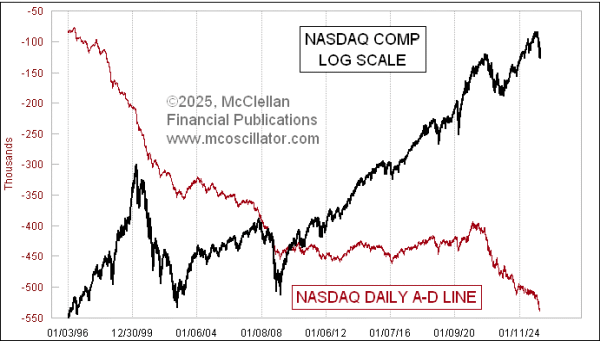
This A-D Line has never once made a new all-time high. It started downward from the beginning of the data in 1972, and has never made it back to that level. The reason is that the Nasdaq has looser listing standards for companies to trade on that exchange, and so the more marginal companies which are eventually going to go broke are more likely to be listed on the Nasdaq than on the NYSE. Every day that a stock spends traveling from its IPO price to zero contributes to the Declines column, and pulls down this A-D Line. So if you ever hear an analyst talking about a bearish divergence between the Nasdaq Composite Index and the Nasdaq A-D Line, you can know for sure that analyst does not know what he is talking about. It makes such divergences all the time.
But that does not mean the Nasdaq A-D data are entirely without use. These data do not travel in a straight line, and so there can be useful information in looking at the up and down accelerations of the data. That is where the McClellan A-D Oscillator and McClellan Summation Index come into play. They work by measuring the acceleration that takes place.
The very low recent reading for the Nasdaq's Summation Index is a sign that there has recently been some extreme downward acceleration in the A-D data. The extreme reading says that the selling wave has probably gone on about long enough, and then the upturn in the Summation Index shows a shift back to upward acceleration. Such a signal can be subject to whipsaws, as can any indication of a price trend. But for now it is a decent indication of a meaningful price bottom. That does not mean it has to be a permanent price bottom, though.
Tom McClellan
Editor, The McClellan Market Report
Jan 23, 2025
NYSE A-D Line Divergence |
Jul 21, 2022
A Subtle Message in the Volume Summation Index |
Apr 07, 2021
The Message of a Bumpy Summation Index |