QE is Bullish for Stocks, Bearish for Bonds

Free Chart In Focus email
Delivered to you every week
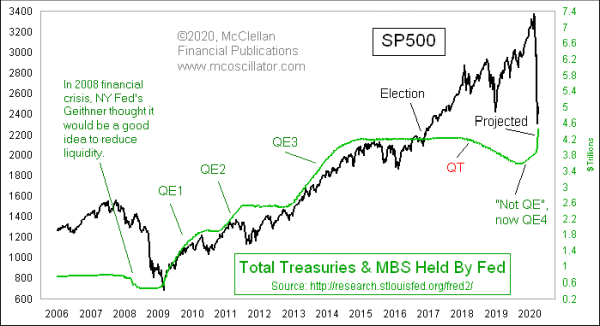
The Federal Reserve invented “quantitative easing”, or QE, back in 2009, as a way to try to stimulate the economy out of the damage of the 2008 financial crisis. It worked! Or perhaps I should say, it worked at lifting up the stock market. Its effect on the actual economy is still open for debate.
When I say that QE1 worked for the stock market, I should clarify by saying that it worked right up until the Fed stopped doing it. Once they turned off the spigot, liquidity dried up, and we got the May 6-7, 2010 “Flash Crash”. Eventually the Fed decided that more QE was needed, and so we got QE2 starting in late 2010.
That program worked great as well, right up until the Fed suddenly turned off the spigot once again. When QE2 was shut down in June 2011, we very quickly saw a sharp drop of 19% in July 2011. This reinforced the point that QE is great while it is going on, and horrible when the Fed shuts it off.
QE2 was followed by “Operation Twist”, seeking to nudge the yield curve by swapping long term for short term Treasury debt. The conclusion was that it was not getting the job done, and so the Fed started QE3 in earnest beginning in late 2012. That program worked great(!!), lifting the SP500 from 1418 when it started in Dec. 2012 up to 2089 in Dec. 2014 when the taper finally petered out. At its peak rate of purchases in QE3, the Fed was buying up around $60 billion per month of Treasury and mortgage backed securities (MBS) debt.
QE3 worked great right up until the Fed stopped it. Once the spigot was turned off, stock prices moved sideways for much of 2015, and then we got a China-induced liquidity crisis in August 2015. That sharp drop had its echo with a retest low in January 2016.
After QE3 was done and gone, the stock market and the economy finally started to run better on their own, perhaps aided by President Trump’s 2017 tax cuts package, and the lessening of the regulatory burden. But the novel corona virus in 2020 has thrown a serious wrench into the machinery.
Now in response, the Fed is starting QE to a degree never before contemplated. QE3 was $60 billion per month of debt purchases. This week, the Fed is doing purchases of $125 billion PER DAY!! The intent is that those purchases will be $75 billion of Treasuries, and $50 billion of MBS. PER DAY!! The Fed is shoving a firehose down the mouth of the banking system, and turning the valve up full blast.
The 11% rise in the SP500 over two days on March 24 and 25, 2020, says that the firehose is starting to do its job. And if the Fed keeps it going, that promises more gains in the weeks ahead, assuming that the lessons of QE1, 2, and 3 will work once more. This part of the story at least makes sense: Having the Fed throw money at the banking system makes stock prices go up. Okay great, so far, and for as long as the Fed keeps the firehose going.
The curious part of the story involves the instruments that the Fed employs in its QE, meaning the T-Bonds that the Fed buys up in order to push money into the banking system. We all learned in Econ 101 that if the demand for an item increases, then the price of that item should go up in response. So under that theory, if the Fed arrives into the marketplace saying “I’ll buy your T-Bonds”, then the bond market should respond by jacking up the price of that item. That is how it should work in theory.
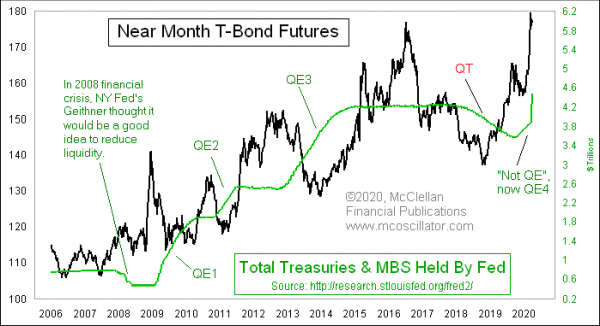
But in the real world, it works differently from the theory. The 3 rounds of QE that we have already seen have each been bearish periods for bond prices while they were underway. When the Fed turned off the spigot, it was suddenly better for bond prices. Here is a chart to illustrate this point:

We only have 3 rounds of QE so far to judge by, but each of them saw falling T-Bond prices during the period when the Fed was making its purchases of T-Bonds and MBS. And when the Fed shuts off the spigot, bond prices recover.
This is an important lesson to understand as we undertake to grapple with what QE4 is going to mean, especially when we realize that the Fed is throwing more money at the banking system and faster than ever before. Bond prices have already seen a blowoff price top, pushing most of the maturity spectrum down below 1% yields. With the Fed now inserting itself once again, we should expect to see the curious rules of QE economics bringing lower bond prices, at least for as long as the Fed keeps this new round of QE going.
Tom McClellan
Editor, The McClellan Market Report
Jun 09, 2016
ECB QE Doing Opposite of Objective |
Feb 28, 2020
Fed Pulling Back from Repos at The Wrong Time |
Nov 08, 2019
Treasury Department Is Not Biting Too Hard |