Quietest Range In 2 Decades

Free Chart In Focus email
Delivered to you every week
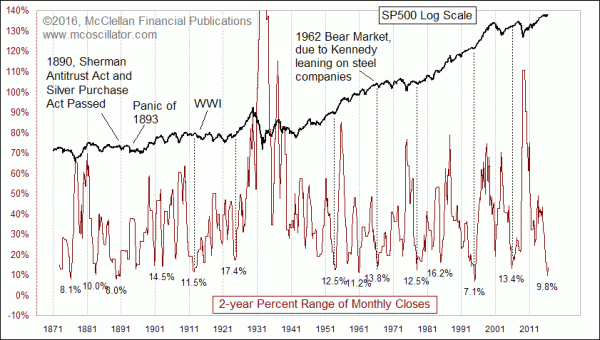
The history of the SP500 dates all the way back to 1871, thanks to the work of the Cowles Commission in the 1930s which reconstructed an index of stock prices back that far. That index eventually morphed into the SP500 we know today.
I mention this history, because we have just seen one of the quietest 2-year periods in the SP500 in all of its history. That’s fun to know, but so what? The “so what” comes from looking at what has followed similar low volatility periods in the past. Generally speaking, the answer is that the market starts moving upward again.
Perhaps the best example was 1994-95, when this 2-year range measure hit an all-time low of 7.1% (based on monthly closing values). The 1995-98 rally which followed was one of the best and strongest bull markets ever.
At other times, especially farther back in history, outside events like World War One got in the way of the promised rally. And the prior record low 2-year range in 1890 coincided with the passage of new legislation which harmed businesses and banking liquidity, and which led to the Panic of 1893. In 1962, President Kennedy leaned on the steel companies to keep them from raising steel prices, even sending FBI agents to steel CEOs’ homes to convey the president’s displeasure about their plans (they did not have Twitter back then, so the agents became the messengers). That governmental intrusion into the operations of businesses set off a 27% bear market in 1962, but stocks then quickly recovered and then some.
The point is that most of the time, if something or someone does not interfere, these quiet periods are followed by strong new uptrends.
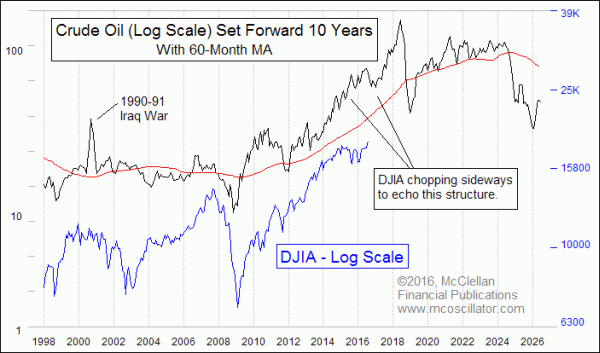
Interestingly, this recent quiet sideways period for the market echoes one that occurred 10 years before in crude oil prices. I have previously shown the 10-year leading indication that oil prices give for the stock market, and it keeps on working.

Just ahead, we should get to experience the echo of oil’s big price rise into 2008, which fits well with the phenomenon described above, where really quiet 2-year periods are usually followed by strong new uptrends. We will also likely get to experience the 10-year echo of oil’s crash out of that bubble top.
Tom McClellan
Editor, The McClellan Market Report
Mar 25, 2011
Oil Predicts Stock Market Dip |
Jul 07, 2016
NIRP Disrupting 60-Year Cycle |
May 26, 2016
El Niño, La Niña, & The Stock Market |