September Does Not Control October
Free Chart In Focus email
Delivered to you every week
September has a well deserved reputation as a bad month for the stock market. For the period from 1928-2008, the month of September has only been an up month 43% of the time, with an average SP500 return of -1.22%.
Certain years have been extremely notable for their September weakness. The SP500 in 1931 lost 29.94% in September (actually that was for the Cowles Index, which preceded the SP500), and just last year the SP500 was down 9.21% in September as the market was melting down and Lehman Brothers was allowed to collapse.
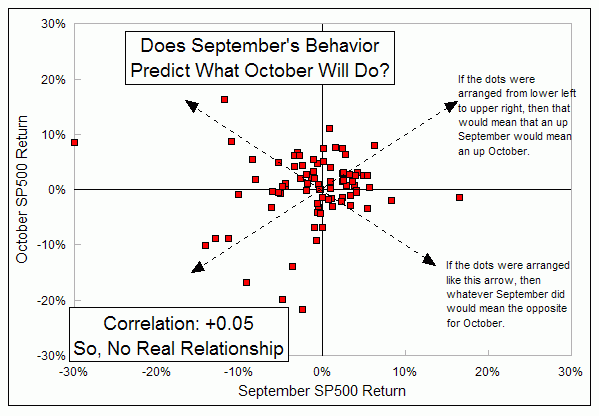
But not every September turns out ugly. This year, September saw a gain of +2.68% for the spot SP500 Index. There has been some talk lately in the financial media suggesting that if September is not weak, then that means October should escape price risk as well.
Today's chart tests that hypothesis, and it deserves a bit of explanation. This type of chart is known as an "X-Y Chart", or sometimes as a "scatter plot". Each dot on the chart represents the combination of the September and October SP500 performance for one year. The September performance is arrayed on the horizontal X-axis, and October's performance is on the Y-axis. What we see is a pretty wide dispersion of the dots, almost as if the chart was made by a shotgun blast.
If the dots were more tightly arrayed in a nice slanted line, either slanted upward or downward, then we could infer that there was a strong relationship between the market's performance in September and how it does in October. But the wide dispersion shows that there really is no consistent relationship.
That point is further emphasized when we do a computational analysis of the data. The Pearson's Correlation Coefficient measures how well two sets of data are related to each other, and expresses that correlation with a value between -1.0 and +1.0. A high positive number means that the two are strongly positively correlated, meaning an up September would bring an up October. A deeply negative number, down close to -1.0, means a strong negative correlation, which would mean that October does the opposite of whatever September does.
The actual number is +0.05, which means that the two really are not related at all in the long run. There are certainly times that can be found when an up September is followed by an up October. Indeed, the numbers show that if September is an up month, then the October performance is up 65.7% of the time which seems like a pretty good probability. But that is not much better than the 56.8% random probability of an up month in any October.
The point one should take from all of this is that a lot of claims get made about how one market event or behavior means that we'll see another behavior as a dependent relationship. Such assertions should be evaluated to see if they really have merit, and the September-October relationship turns out not to be as significant as some might believe. October very well might be an up month, but it won't happen because of September causing it to happen.
Tom McClellan
Editor, The McClellan Market Report