Where Did the 9-Month Cycle Go?

Free Chart In Focus email
Delivered to you every week
The 9-month cycle in the stock market used to be a very regular and important factor governing stock price movements. But recent changes in the rules and structures of the markets may have made this cycle go the way of Saturday trading and paper stock certificates. Or perhaps it has just changed itself into a new form. Let's take a look.
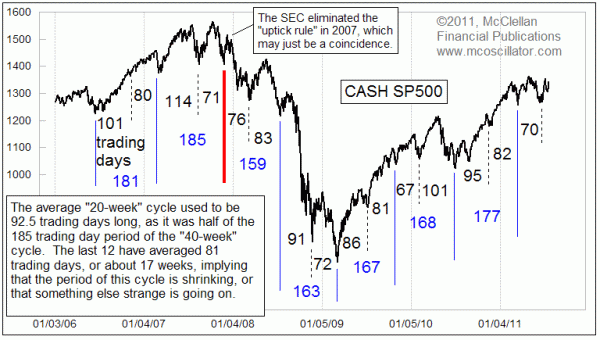
My lead chart this week highlights what I am talking about. Before 2007, there were important bottoms about every 185 trading days. Cycles analysts for years have called this the "9-month cycle", or the "40-week cycle", even though the precise period was a little bit shorter than those numbers. Big round numbers are easier to say, which is why those names were used.
In addition to the major cycle lows every 185 trading days, there was also a significant mid-cycle low that would appear somewhere in between the major bottoms. The mid-cycle low was usually not as punctual, and could arrive early or late, even as the major cycle low would tend to be more on time. This mid-cycle low was a "harmonic" of the frequency of the major cycle low, meaning that they were even multiples of each other. Harmonic frequencies are a big deal for mechanical engineers dealing with solid structures, but they also show up in other arenas like the stock market.
Starting in 2007, this all changed, as delineated by the red vertical line. It was hard to understand this change as it was occurring at the time, but easier to see now that we have the luxury of looking back at the historical data. What appears to have happened beginning in 2007 was that the length of this cycle contracted dramatically, for both the major cycle and the mid-cycle periods.
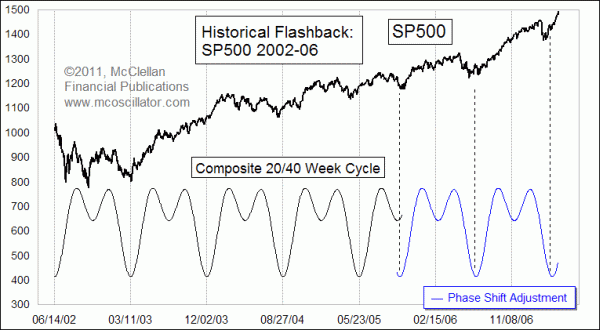
One of the reasons why it was so difficult to understand this change in period as it was occurring in real time is because of another trait of this cycle, which is known as a "phase shift". In my historical research, I have identified the 9-month cycle as working on the stock market all the way back into the 1960s, although curiously not so much before then. One of the more interesting behaviors of this cycle over that time period is that about every 6-8 years, the 9-month cycle would seem to skip a beat, and then start up again on some new schedule. Here is a great example of this behavior:

In the lower portion of this chart, there is a modified sine wave pattern to help visualize the behavior of the cycle in the SP500's price movements. The market was following this cycle pattern very nicely up until late 2005, and then it jumped onto a new schedule that just happened to be about a half cycle length off of the original schedule.
So with the knowledge that a phase shift was a possibility with this cycle, it was hard to understand what was happening in early 2008. And this illustrates one of the big pitfalls with doing any sort of cycle analysis: cycles can change, and so while they may give us nice predictions of what should happen at some point in the future, there is no guarantee that the past behavior will remain in effect in the future.
It just so happens that 2007 was when this cycle changed, and it was also the year that the uptick rule for shorting stocks went away. It is hard to understand why a rule change like this could make a difference on a market cycle, but I have an explanation that may help.
Imagine a wave pool in a laboratory, where scientists create waves to study how they travel through the water. Now imagine that you remove all of the water, and replace it with 30-weight motor oil. Because the oil is lighter but more viscous than the water, the behavior of waves in that wave pool would understandably be different.
So thinking of the financial markets, if the regulators were to do something that changes the "viscosity of money", making it flow more or less easily, then we would likely see changes in the way that waves propagate through that medium as well. Such changes might include restrictions on shorting stocks, the advent of money market funds, the introduction of stock index futures and options, leveraged ETFs, etc. All of these affect the ease with which money can flow into and through the stock market.
Now, if you look back at the top chart, you can see that the blue numbers are getting bigger again lately. Those numbers represent the time period between the major lows of this cycle (formerly known as 9-month). The lowest number was 159 trading days in early 2008, and it has climbed back all the way up to 177 as of the latest major cycle price low. It may be that after the initial shock, this cycle is working on getting back up to is "natural" frequency. Or it may be that 159 and 177 are just the widest extremes of a new range of cycle periods that average more like 168 trading days, and that this is the new natural frequency. We won't know for sure for several more cycles' worth of time, and that's the big problem with this analytical technique.
For what it's worth, and to help your planning, 159 to 177 trading days from the most recent major cycle low equates to a timeframe of Oct. 31 to Nov. 25, 2011.
Tom McClellan
Editor, The McClellan Market Report
Mar 25, 2011
Oil Predicts Stock Market Dip |
Nov 05, 2010
Entering the 3rd Presidential Year |
Aug 27, 2010
60-year Cycle In Interest Rates |