Does Crude Oil Exhibit Support/Resistance Behavior?
The notion of static support/resistance levels that we all are acquainted with from stock charts is not applicable to charts of commodities. If this were a stock chart, then the notion of seeing the price level of a prior high turn into a support level later on may indeed be legitimate, although many small cap stocks do not exhibit this behavior as well as blue chip stocks do.
But commodities like oil are different from stocks in many ways, and the physics driving the support/resistance level phenomenon in stocks are largely missing from commodities. In order for support/resistance levels to work in a stock’s price pattern, there is the need for human interaction. Some trader(s) must remember that price level and respond to it upon seeing it. The same buyers who were willing to buy at the level of a prior top, and thereby overwhelm the sellers waiting at that level, would need to remember that this price is a good buying point and they would need to step forward and buy again to offer the support when the price gets down to it. Also, the stock trader or investor who bought at that price and helped get the stock up above the prior high is likely to still be holding those shares, and to realize that the price is back to a level where he thought the shares were a bargain. The scenario I just described can also be turned around, substituting the word “resistance” for “support” in the other direction. This human interaction in response to awareness of a price level is why the phenomenon of support/resistance price levels can be found to work in stock price charts.
In oil, however, the trader who bought an oil futures contract back in June has most likely sold it already, since oil futures trade a huge fraction of the total open interest every day. On Aug. 27, 2004, for example, the November Light Sweet Crude Oil futures contract traded volume of 40,703, versus a total open interest of 78,423. Stocks, on the other hand, trade only a small percentage of the float each day. So that trader who bought that contract at the breakout price (helping it to exceed the prior high) is not going to act as the agent who will cause the support to work, because it does not matter to his portfolio that the price is back to a level at which he once bought oil in what to him is the distant past. If he was a pure trader, then he has flipped that position many times. If he is an oil company’s buyer who bought the contract for actual delivery, then that oil has already been refined into gasoline, plastic, and fertilizer.
There is also the issue of the units in the crude oil market not being identical to each other. If you bought 100 shares of IBM back in June, those shares would be identical to every other share of IBM, and unless the company diluted the float with a secondary offering the claim on ownership of a portion of the company would still be identical. But in the oil futures market, there are at least 3 different types of “crude oil” contracts to trade (Brent, West TX Light Sweet, and Clearport), plus there is also heating oil and unleaded gas, all of which can be arbitraged against each other. In addition, there are different contract expiration months which trade at a premium or discount to each other. ©2004, McClellan Financial Publications, Inc.
So if one wants to ask where oil prices closed on June 1, 2004, the answer is a range between $37.21 and $42.33 for all of the contracts due to expire within a year from that date. Other contracts beyond a year out would be at an even lower price. The “near month” contract that day was the July contract, so its close of $42.33 might constitute the basis for deciding on a support level. But the current “near month” contract right now is the October contract which closed at $41.20 on June 1. So which price is the proper support level? That is a rhetorical question, not meant to be answered.
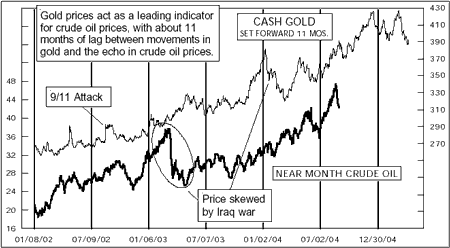
One other factor which helps to disrupt the human interaction aspect of a static support/resistance price level is that the players in the oil market use different currencies. So a price that a dollar-based trader might see as an important support level for dollar-priced oil would look far different to a trader whose base currency is euros or yen. This is one of the big reasons why static support/resistance levels don’t work in gold charts. Dynamic ones can work, through the magic of trendlines or moving averages of various types, but static price levels do not work.  I don’t dispute the call for an upside price objective in the $50s. The first chart below shows how gold prices serve as a leading indication for oil prices 11 months later, provided that no extreme geopolitical events put their thumbs upon the scale. Gold’s top in January 2004 says that we should see a top in oil prices around December 2004, and above the level of the recent high. This recent pullback is the echo of one that occurred during gold’s march northward, and should just be a temporary event.
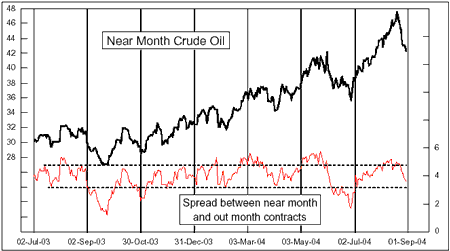
  The second chart provides insight into why this short term spike downward ought to be ending soon. The indicator in that chart (red line) reflects the spread between the near month contract price and the contract 11 months out. When the spread gets too wide, it indicates a price top for crude oil. When it narrows, it indicates a bottom. As with any overbought/oversold indicator, the trick can lie in determining where “high” and “low” lie, and indeed this indicator has gone to negative values in the past (late 2001 to early 2002). The dashed horizontal lines I have added to mark overbought and oversold are arbitrarily placed. By moving to a low indicator reading, near month crude oil is getting closer to the long-term price expectations represented by the out-month contracts, and that generally indicates a short term bottom condition.