Special Market Reports
Sherman McClellan’s Presentation to the Market Technicians Association

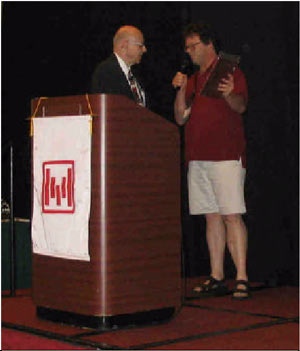
First of all I would like to thank the president of the Market Technicians Association, Fred Meissner, and the MTA board of directors for bestowing this honor of a lifetime achievement for pioneering in technical analysis in the 1960s and 1970s on Marian and me for the contributions to technical analysis that were made by us. Marian would be most proud if she could be here. As many of you know, she died November 26, 2003. You need to know that without her mathematical background, computational skills, and excellent organizational skills the development of the McClellan Oscillator would not have happened. It was her idea to create the Summation Index, the area under the curve for you calculus students, that consisted of the cumulative total of the daily postings of the McClellan Oscillator.
A gentleman by the name of Jimmy Hixson down in Louisiana apparently played a part in today’s affair and for that I wish to thank him.
Now, let’s get into the subject for today, the development of technical analysis in Los Angeles and the Southern California during the 1960s and 1970s. This is a multimedia presentation. You have a printed handout that my son, Tom, prepared from his writings. That covers the calculation information that anyone would need to work with the McClellan indicators. Also there is included the entire booklet written by P.N. Haurlan in 1968 called Measuring Trend Values that describes the implementation of exponential moving averages. This was our bible for development of the McClellan Oscillator the following year. And finally there is a thesis written by Tom on the continuing importance of breadth and its measurement. Your lifetime achievement is to wade through all this stuff.
I was impressed with the large number of young people that attended the last MTA/IFTA meeting in Washington, DC. It occurred to me that some of them were not around to see the crash of 1987. I happened to videotape all of the broadcast that day of October 19th, and have excerpted that into about 18 minutes. My tape machine creates static frames between time breaks, so you will be able to follow the time skips. Pay particular attention to the price of IBM. If there are older persons here who will suffer psychological flashback problems from watching, you are welcome to exit right now. The last 12 minutes of the tape show Gene R. Morgan presenting his charting the market show on Channel 22. The postings on the price charts for the major indices tell the day’s story.
While the video is running without sound, I will try to give you some flavor of the climate for technical analysis in Southern California and some background and description of some of the players.
The video starts with a recent flight of a Wright flyer replica and ends with some more modern aircraft. Crashes were and are part of the history of aircraft. And crashes are also very much a part of the history of the stock market. Both are the result of out of control conditions. Both terminate a prior decline. And there will be more crashes by both planes and markets in the future.
Alan Greenspan started his career a few days before the crash of 1987 and played a part in precipitating it by raising rates and tightening credit, to establish his credibility. The results surely made him more cautious than he might have otherwise been. If he had only paid attention to the McClellan Oscillator and Summation Indices he might have had insight into liquidity issues for the economy and the market at that time and in later years.
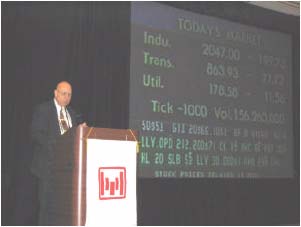
Let’s get the video started. You will see old display boards that were made by Quotron. The plastic molding company that our family owned made the plastic cams that when rotated on a shaft changed the numbers that were displayed. They were noisy clankety machines and very limited in their ability to display the action under crash conditions. The computers on the floor were able to keep up with the selling conditions, but the tape got behind by over 2 hours later in the day.
Channel 22 KWHY created the first financial TV broadcast in the United States in the early 1960s. It was tough for them to get the large Wall Street firms to support the effort. It was too new and different. There was some of the professionals’ “don’t advertise” thought and mentality. That meant that the smaller, more innovative people and small firms had to take up the slack. Bert Harris was the owner of KWHY. Anyone with money for advertising had access to the airwaves. KWHY was the first to run the ticker across the bottom of the screen.
P.N. Haurlan worked at JPL (the Jet Propulsion Laboratories) in the 1960s and 1970s. In 1962, he was manager of the Voyager study that worked out how to use Jupiter’s and other planets’ gravity to accelerate a spacecraft further away from Earth. It was canceled in 1967 before being restarted in time to launch Voyager 1 and 2 in 1977. The slowdown and cancellation accelerated Pete’s development of applying spacecraft tracking techniques to stock market tracking. He started writing the Trade Levels Report in the 1960s and began to advertise on KWHY, sponsoring the after market report called Charting The Market. It was hosted by first Barry Ross and then was later hosted by Gene R. Morgan, who you will see on the video. Gene Morgan is a classic Edwards and Magee chartist. He is retired now and he and Judy Myer are living in Las Vegas, Nevada.
Gene’s use of Hurst Cycles got across the idea of market rhythm. Gene and Kennedy Gammage put on one-day learning sessions of “what they don’t teach you in college”. At least that was true at that time, although academia is now playing catch up. Pete Haurlan also ran seminars to introduce his Trade Levels Report. Various stock and commodities brokers also hosted seminars to promote their brand of how to make money.
For Christmas in 1968, Marian gave me some chart paper and the promise of some time to work on market timing. We were frustrated in getting the Trade Levels Report on Saturday or Monday only to find out that Pete had issued a buy signal the previous Tuesday. What became the McClellan Oscillator was created by the summer of 1969. One day that summer, Gene invited anyone who had a new indicator to contact him. I was the only one, and he arranged for me to present the Oscillator and Summation Index on the Charting The Market show. Gene Morgan gave the indicators their name of McClellan Oscillator. He helped us get advance-decline data back to 1962 from books he had in his library and others that he had access to. All that data was calculated by hand by Marian and then hand posted to charts by me for our book Patterns For Profit that described the calculation and use of the McClellan Oscillator and Summation Index. This book was initially published by Trade Levels and is now published by McClellan Financial Publications, Inc. 
Pete Haurlan was a true rocket scientist at JPL. He was manager of the Voyager study in the early 1960s, and then section manager for advanced technical studies in the JPL office of plans and programs at the top of the management pyramid. In 1968, there is a memo from a man named Felberg, Homer J. Stewart, and Peter N. Haurlan that gave 8 examples of prospective future missions, including Venus/Mercury, Grand Tour, Jupiter Orbiter, Outer Planets, solar electric missions to Mars and Venus, Jupiter gravity-assist missions, and comet and near-asteroid missions. At night, when the JPL computer was not in use for JPL business, he was able to start tracking the stock market using spacecraft tracking techniques. Some of those techniques would later be used by Marian and me to get some useful information out of A-D, volume and price data. Eventually, Pete started the Trade Levels Report and bought his own computer. To get the message out, he sponsored the Charting The Market show on KWHY. Along the way, Dave Holt went to work for Trade Levels. After Pete Haurlan died in the early 1980s, the company was bought by William Mason for the stock analyzing tools that it had but was not interested in the public distribution of that information. Dave Holt went to Wedbush, eventually getting the Trade Levels computer analysis back. Dave Holt operated money management services until March 31, 2004, and is now retired except for participating in dispute mediation and arbitration. Dave did a weekly cable TV show on CBN (Christian Broadcasting Network) called This Week on Wall Street directed by Terri Mayo.
Kennedy Gammage was a frequent guest on Charting The Market. He writes the Richland Report. That name comes from the name and ashes of the family plantation in the south. Kennedy was influenced by a money manager named George Chestnut and his assistant Warren Green. They didn’t care whether a company made bombs or sweaters as long as the chart went up. Kennedy still does his money management, and still writes the Richland Report. He did work for Mansfield Mills until they were bought out by a bank. The new owners couldn’t deal with someone actually using charts to manage other peoples’ money and they parted ways. His Richland Report has featured the McClellan Oscillator since its invention. I wrote to him in August 1987 and said that a very important Summation Index top was put in, and that a very weak market was coming. He was kind enough to print that letter.
There were many other market analysts and gurus that appeared on KWHY or were inspired to become such from watching.
Richard Russell started writing his Dow Theory Letters in New York in 1958 and moved to Southern California in 1961. His more conservative subscribers, banker types and such, had his reports mailed to their homes rather than to their offices. They couldn’t be seen paying attention to his brand of technical analysis, which is classic Dow Theory, developed by Charles Dow, expanded by Hamilton, and developed further by Robert Rhea from 1932 through 1939, when Rhea died. Russell had 30 articles printed in Barron’s but editor Bob Blackburn was reluctant to publish the first one and needed special permission. Later, Bob Bleiberg was more amenable to Dow Theory articles. I asked Richard if he had any message to convey to this group, and he said that Dow Theory says the up market is an upside correction within a larger down market. Richard Russell is remembered for his appearances on KWHY, and his call of the 1974 bottom.
Peter Eliades was a Hollywood personality first but found the stock market fascinating. He picked up on the cycle concepts, became a broker with Fred Gregory, and began appearing on KWHY. He started his market letter in 1975, as the bull market took off. Later when FNN got started in 1980 and Peter appeared on both, Bert Harris of KWHY made him choose one or the other but not both. Peter moved north in 1990 and has done interviews on CNBC, CNN, WCIU. Peter’s cycle work called for the 1974 bottom between December 9 and 14. It was that successful public call that launched his newsletter career. His later work led to the MTA Charles Dow Award for his analysis of The Sign of The Bear.
John Bollinger is also a product of the Southern California scene. His work with standard deviation and Bollinger Bands is well known. He was seen on KWHY and later was a major feature on FNN and its successor CNBC.
People from out of town also made a pilgrimage to Hollywood and influenced the locals. They had names like Robert Prechter with Elliott Wave, Terry Landry and his Magic T, Richard Arms Jr. and his Trading Index, now the Arms Index, Arch Crawford with his astronomical and technical approach, Joe Granville with his own unique persona, Larry Williams teaching us to trade, and others.
And there were the locals:
William O’Neil started Investor’s Business Daily, and his followers waited in line to get their Daily Graphs charts hot off the press. His protégé David Ryan won investing championships, appeared on KWHY, and started his own money management firm.
Gene Inger was KWHY’s local iconoclast until he moved back east.
Righard Mogey from the Foundation for the Study of Cycles appeared.
Larry Katz did and does his Elliott Wave Theory analysis.
Stan Harley does Gann, cycles, and Fibonacci.
Steve Todd does the Todd Market Forecast and some good analysis.
Frank Barbera was a regular employee of KWHY and did gold stocks analysis on his own.
Others were Steven Check’s more fundamental analysis, Richard Ney analyzing the volume numbers of the specialists, Sy Harding, Jim Sibbett, Earl Haddity, John Ehlers, and there are surely others that I missed.
One other name is Jim Miekka that you may not know. He is a blind mathematician. He writes a little known market analysis letter called the Sudbury Bull & Bear Report. He did the math to generate the McClellan Summation Index using only the 10% and 5% Trend values. He also identified a condition that Kennedy Gammage named the “Hindenburg Omen” which predicts a high probability for a crash within the next 30 days only. That omen showed up ahead of the crash in 1987. It is not in the MTA book of knowledge, but I will see that it gets there. Now let’s listen to the video as Gene R. Morgan reports the closing numbers as prices wiped out 22 months of progress on October 19, 1987.
[Ed. note: What followed in Sherman’s presentation was a videotape of Gene Morgan’s Charting The Market show from the day of the 1987 crash. We hope to make copies of this.]