Architecture Billings Index Forecasts The Economy

Free Chart In Focus email
Delivered to you every week
There are already several signs that the economy may be slowing itself into another recession, but a relatively new index is gaining a lot of attention. The Architecture Billings Index (ABI) reflects surveys of about 300 architectural firms in the U.S. It is a diffusion index, measuring the percentages of firms reporting a significant increase or decrease in activity. There are two components, inquiries and billings, and the data are seasonally adjusted to reflect the fact that certain times of the year are less busy than others.
The American Institute of Architects maintains the index data, and you can read more about its computation and use at http://www.aia.org/aiaucmp/groups/aia/documents/pdf/aias076074.pdf.
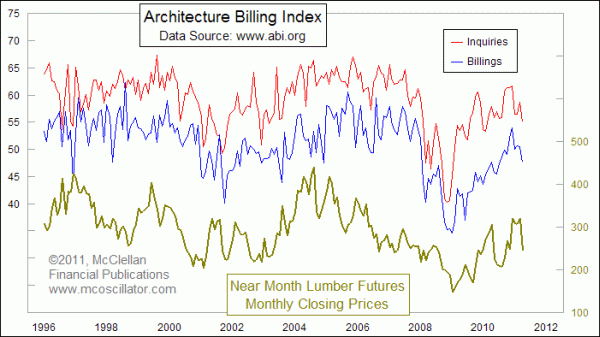
It is not surprising to see that both the Inquiries and Billings Indices correlate well with lumber prices, given that both lumber and architectural work are big inputs into construction activity. I have noted in past Chart In Focus articles (linked below) how lumber prices are a great leading indicator for several important aspects of the economy.
It is important to point out that these data are not in the public domain. I got them by subscribing, with the condition that I not share the raw data, but it is okay for me to chart them and share them in this way. I was also asked to add this statement: "For more information, or if you would like to subscribe to the Architecture Billings Index dataset, please contact James Chu, Director of Market Research at the American Institute of Architects, jchu@aia.org or (202) 626-8045."
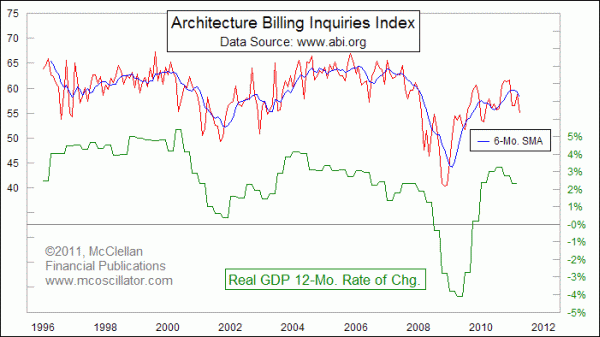
Given the ABI data's good correlation to the economically sensitive lumber prices, I wanted to take a look at how these data relate more directly to GDP. So I created the chart below which examines the ABI Inquiries Index versus the annual growth rate in real GDP. I found it interesting that the Inquiries version correlated a little bit better than the actual Billings data for this purpose.

Even with the seasonal adjustments already included in the data, the raw index values still show a good bit of noise. So I added a 6-month simple moving average (SMA) to help calm down the data. What we see when considering both the raw values and the moving average is that there is a slight leading indication given for what the GDP numbers will do. The ABI data correctly foreshadowed the big downturn in GDP that we saw in 2008, and also gave an early warning about the rebound in GDP that was to commence from the low in the 2nd quarter of 2009.
It is nice to have that slight leading indication, for anyone concerned about what GDP numbers will do, but here is where the real value is. The ABI data are published each month, and thus they come out well in advance of the quarterly GDP numbers compiled by the Commerce Department. So without having to wait to see what the GDP numbers did in hindsight, you can look at the ABI data to get a pretty good idea of what the GDP data are going to say.
Both the Inquiries and Billing indices topped in December 2010, and have been falling throughout 2011 in spite of the Fed's efforts to inflate the money supply via QE2. The Billings index is back below 50, showing overall shrinkage in billings for the firms surveyed. With POMOs set to end this month, the stock market and the economy are going to have to try to survive without the Fed's steroids. The ABI data suggest that this summer is not going to go well in the post-QE2 environment.
Tom McClellan
Editor, The McClellan Market Report
Aug 28, 2009
Lumber Says Economic Slowdown Not Complete |
Apr 30, 2010
Lumber Prices Show Good News for Jobs |
Dec 31, 2010
Lumber Prices Call For Housing Stocks Rally |
Apr 29, 2011
Copper and the Commitment of Traders Report |