Are Deficits Bullish For Gold?
Free Chart In Focus email
Delivered to you every week
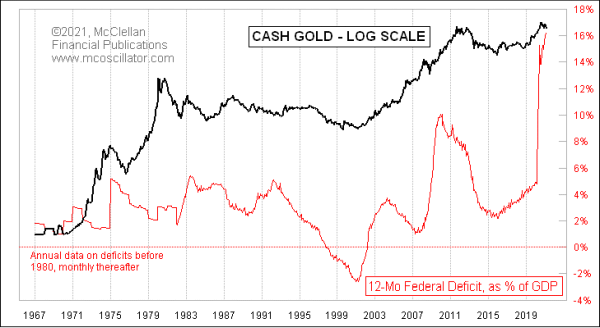
Congress and the White House seem intent upon spending a lot more of our money. In the past 12 months ending in February 2021, the federal government has spent $2 for every $1 it took in. That has boosted the deficit up to an amount never seen before, neither in nominal terms nor as a percentage of GDP.
Spending money that the government does not have is assuredly bullish for the stock market. And it is potentially inflationary, which should presumably be a bullish factor for gold prices given gold’s role as an inflation hedge. But it is an open question worth exploring about whether and how large deficits might be bullish for gold prices.
This week’s chart looks back to the late 1960s, when gold’s hold on the $35/oz fix was first starting to get shaken. This long look allows us to see how the changing levels of federal deficit correlate, or don’t, to gold’s price movements. It is not a perfect correlation, but it is good enough to allow us to say that generally speaking, rising deficits are bullish for gold and falling ones are bearish. There are exceptional moments when this rule has not been followed, but generally it has worked.
Gold prices started rising again from the bottom in late 2015, which coincided with the federal deficit starting to rise again as a percentage of GDP. Gold got an extra boost with the government’s bolus of spending on Covid in 2020, but the effect of that extra spending already appears to be wearing off in terms of being able to move gold prices. Gold has already fallen more than 300 points off of its August 2020 high, even though this measure of the deficit continues to rise slightly and is still at a high level.
And right there is the key point to this relationship. Gold is not helped by high deficits, but rather by rising ones. There is not much room for the federal deficit to continue rising, especially versus GDP when the Fed is expecting 6% or higher GDP growth in Q1. The Atlanta Fed says maybe 10% growth rate. That larger denominator means the deficit/GDP plot should fall, even with the additional $1.9 trillion of Covid stimulus just passed. Eventually the party is over, and the hangover starts.
If the deficit/GDP cannot stay up this high, then it can only fall. And a falling deficit/GDP is usually a bearish condition for gold prices and other inflation hedging assets.
Tom McClellan
Editor, The McClellan Market Report
Apr 26, 2018
Deficits and Gold |
Jan 09, 2015
Deficits Are Good, Sort Of |
Jan 14, 2021
Gold Leads Interest Rates |