Another New A-D Line High

Free Chart In Focus email
Delivered to you every week
Gobs of breadth is a good thing. When there is enough money sloshing around the stock market to lift all boats, that means there is a rising tide, which is a condition that tends to persist.
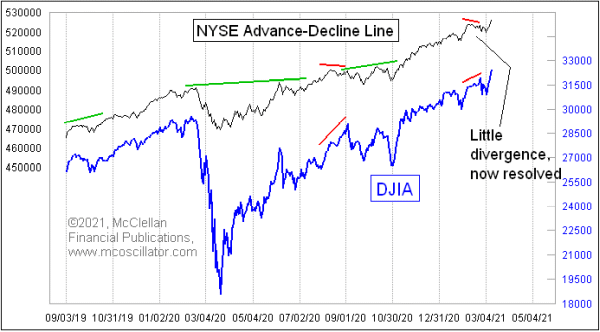
A month ago, there was a tiny little divergence apparent between the DJIA and the NYSE’s A-D Line. Tiny divergences tend to only bring on tiny corrections. It takes a much grander divergence than that, most of the time, to usher in a big bear market.
Still, the tiny divergence was a concern, but now subsequent events have mooted that problem. The A-D Line has now surged ahead to a higher high, along with prices, and so the apparent divergence which was a worry a month ago is no longer a concern. We can still look forward to worrying about one or more additional bearish divergences in the future, but for now the message is that liquidity is just fine and the uptrend should continue.
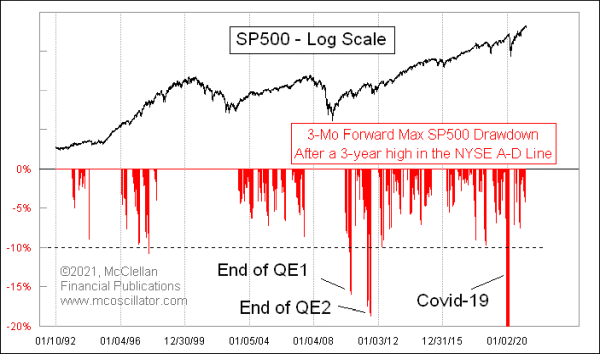
For years I have been studying the implications of a new high in the A-D Line, and what comes next for the overall stock market. The short version of the story is that when the A-D Line makes a new high, it offers some degree of immunity from a bear market. Generally speaking, a new A-D Line high tells us that the worst we should expect is a roughly 10% pullback. Corrections of just 3%-5% are more common when liquidity is plentiful.

In recent years, there have been 3 different events which have tested this “rule”, and which offer useful insights about its applicability. The first two were the sudden shutdowns of QE1 and QE2. A sudden turning off of the liquidity faucet is understandable as a condition that would break normal relationships, and lead to a violation of the 10% drawdown normal limit.
The 3rd event was the Covid Crash, which has broken a bunch of other models of what the stock market should do. It too saw a drawdown in excess of the normal 10% limit.
So the conclusion which we can draw from all of this evidence is that a new high in the A-D Line offers the market some immunity from the normal sorts of bear markets, under normal sorts of conditions. But when a big event like a pandemic or a case of the Fed putting its thumb on the scale intervenes, the normal rules can get broken.
Tom McClellan
Editor, The McClellan Market Report
Feb 02, 2017
A-D Line New High |
Feb 04, 2021
Bond CEF A-D Line Confirming Higher Price Highs |
May 09, 2019
JOLTS Data Stumble, but A-D Line Says Don’t Worry |