Bitcoin’s Quirky Leading Indication for Stocks

Free Chart In Focus email
Delivered to you every week
The relationship between Bitcoin and the stock market is an extremely curious one. Stock prices are supposedly backed by the future earnings capacity of the company. Bitcoin’s value is not really backed by anything. Its value is whatever somebody thinks the value is. And yet the price of Bitcoin and the level of the SP500 do indeed have a relationship.
The frustrating thing is that it is assuredly an imperfect relationship. And it has been a changing relationship over time. Back in 2018, I wrote about how the movements of Bitcoin prices seemed to give about an 8-week leading indication for the stock market.
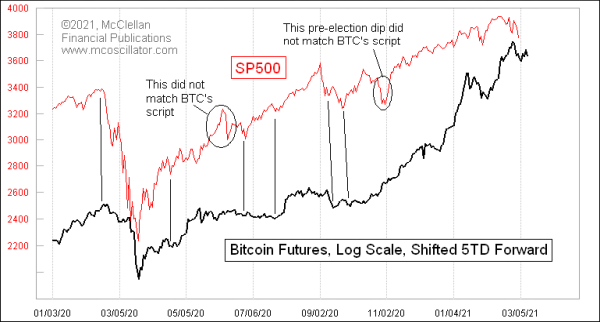
By 2020, that 8-week lead time had shrunk to just 5 trading days. That is the lag time employed in this week’s chart. How and why the lag time shrank is a fascinating question, but not a very relevant one in terms of using or understanding this relationship. One does not necessarily need to understand why something “works” in order to see that it does. Perhaps it is Bitcoin’s greater adoption which explains the acceleration.
For the period under which this 5-day lag has been working, it has assuredly been working imperfectly. A couple of notable instances of the SP500 going off track are noted in the chart. And then, a while after each off-track meandering, the SP500 got back on track again.
Very recently, I have been noticing that the behavior of the SP500 has not been following this model well at all, and I had hypothesized that the 5-day lag might have shrunk to a coincident relationship. But that hypothesis does not work with the most recent data, which instead seem to indicate that the SP500 is getting back on track with Bitcoin’s leading indication, again with the 5-day lag.
If that is the correct analysis, then this moment should be a bottom for stock prices, and the start of a rebound. How far that rebound may go, this model has not told us yet, since it can only see (imperfectly) by 5 trading days into the future. If Bitcoin prices can keep rising, and if the model can keep (re)working again, then that should mean higher prices for the SP500 in the days ahead.
Reaching that particular conclusion involves stringing together a whole lot of “ifs” into a sequential chain, which is a ridiculous way to approach stock market analysis. I would not advise using Bitcoin’s message for the SP500 as a basis of an analysis protocol, since it has proven its ability to be unreliable at times. Still, it is rather fascinating that the pricing of a wholly speculative item which is not really even an “asset” can give us a message a week ahead of time about what is coming for the stock market.
Sometimes the real world is stranger than one can imagine.
Tom McClellan
Editor, The McClellan Market Report
Dec 17, 2020
Bitcoin as Messenger |
Jan 25, 2018
Finally, An Actual Use For Bitcoin |
Feb 11, 2021
Understanding M2 and Stocks |