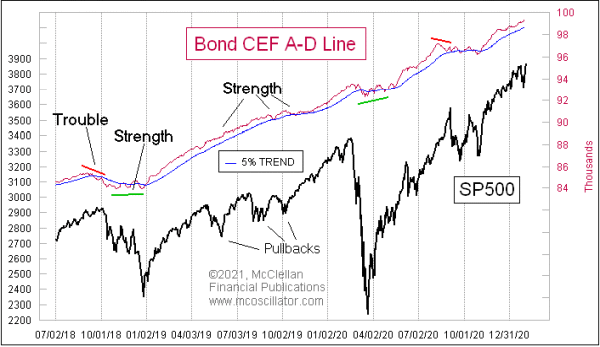
Bond CEF A-D Line Confirming Higher Price Highs

Free Chart In Focus email
Delivered to you every week
I am always on the search for signs of liquidity problems, and Advance-Decline (A-D) Lines are among the best voices to tell us about such problems. It takes a lot of money being thrown at the stock market to lift the majority of stocks. So when the majority of stocks are moving higher, the natural inference is that there is a lot of money behind the move.
One of the big criticisms of the NYSE A-D data is that it is supposedly contaminated by a lot of issues that are not “real stocks”. The worst of these non-conforming issues are the bond-related closed end funds (CEFs), about which some analysts speak ill of with a hiss in their voices. Their prejudice makes some sense, since these bond CEFs are not real operating companies, with earnings and whatnot.
I once thought as the crowd does about these issues, thinking that they must not be good additions to the composite A-D numbers. But then I looked at the data, which I started to compile myself years ago because I wanted to know the real truth. And I continue to go to the trouble and expense of compiling the data because it turns out that the bond CEFs are actually better canaries in the coal mine than the common stocks. They are able to warn in advance of liquidity problems, and they are able to tell us when liquidity is actually plentiful.
That is the message right now, that liquidity is plentiful enough to lift the broad market in a big way. The SP500 had a small swoon at the tail end of January 2021, but the Bond CEF A-D Line kept on chugging higher. It led the way in making higher highs ahead of the SP500 finally catching up.
Bond closed end funds trade a lot more like stocks than like T-Bonds. They are derivative instruments, and thus more sensitive to the vicissitudes of liquidity than the big-cap stocks which drive the indices. If liquidity starts to dry up, these issues tend to be the first to show it. And they are not showing any sign of trouble now, so the message is that liquidity is fine and the stock market ought to be able to continue moving higher. There may be ordinary stumbles and corrections along the way, but when liquidity is strong the market can better absorb those punches and continue moving higher.
Tom McClellan
Editor, The McClellan Market Report
Mar 28, 2019
Bond CEF A-D Line Showing Big Strength |
Apr 24, 2014
Bond CEF Update: Liquidity Is Plentiful |
Dec 10, 2020
Fosback Absolute Breadth Ratio Says This Is Not A Top |