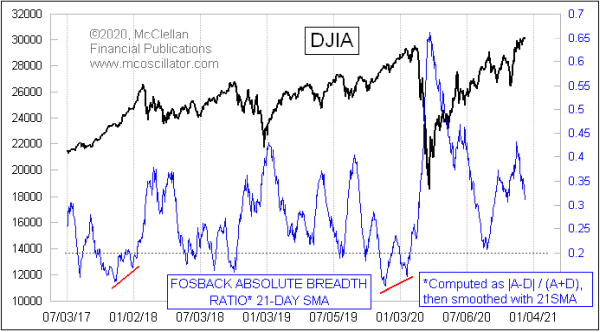
Fosback Absolute Breadth Ratio Says This Is Not A Top

Free Chart In Focus email
Delivered to you every week
To get an important price top, you usually need to see the Advance-Decline (A-D) numbers quiet down. We do not have that condition now, and thus we likely are not seeing the conditions for an important price top (yet).
The Fosback Absolute Breadth Ratio was created decades ago by Norman Fosback. It ignores whether the A-D difference is positive or negative, and focuses just on the size of it. The absolute value of the daily A-D difference is normalized by dividing by A+D (to adjust for any changes over time in the number of issues traded), and then smoothed with a 21-day simple moving average (SMA).
This indicator can be useful for identifying both bottoming and topping conditions for stock prices. High readings tend to occur at important bottoms, as trading gets wilder and more urgent. Tops in the stock market tend to be much quieter, with volatility dying down, and with the A-D difference getting smaller. So when you see this indicator get down to 0.2 or lower, it is a sign that the market could be putting in an important top. It gets to be an even more impressive indication when you get both a reading below 0.2 and then a divergent higher low.
Right now, this indicator is still up pretty high, and that says the market is NOT likely to be at an important top just yet. The market can of course do whatever it wants to do, but for now the message is that this is not an important price top.
Tom McClellan
Editor, The McClellan Market Report
May 30, 2019
Fosback Absolute Breadth, An Old Indicator That is Still Useful |
Jul 13, 2016
Gobs of Breadth: The Haurlan Index |
Aug 26, 2011
Large Absolute Breadth Numbers |