Baltic Dry Index Leads Stock Prices

Free Chart In Focus email
Delivered to you every week
The Baltic Dry Index (BDI) measures shipping rates on a type of cargo ship which hauls “dry” cargo, such as iron ore, coal, etc. as opposed to tankers hauling oil, or container ships hauling big steel boxes of stuff. The BDI has long been considered as an important leading economic indicator, because if steel companies are going to slow down their production of steel, then they are likely to slow down their shipping of the ores they need to make the steel.
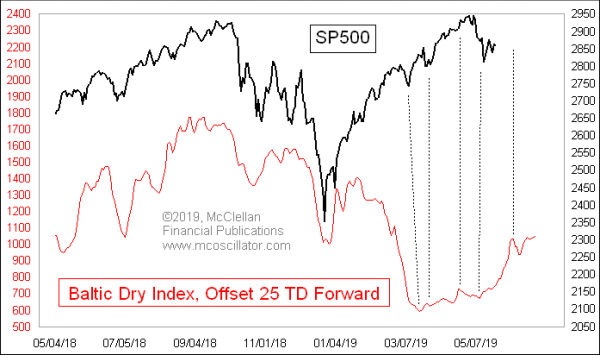
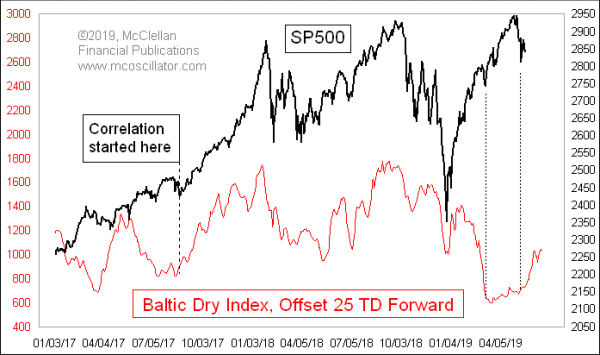
Starting a couple of years ago, the BDI also became useful as a leading indicator for the stock market. Its movements now tend to show up about 25 trading days later in the movements of the SP500. That’s a pretty fun insight, because it can tell us ahead of time about the future movements of stock prices.
This relationship got into trouble in January and February 2019, when a big BDI drop was not echoed in the SP500. That drop in the BDI came about mostly due to the collapse of a dam at an iron ore mine in Brazil, which sent a shock through the shipping market because of the sudden cutoff in the shipping of that mine’s ore.

It is understandable that if the BDI is reflecting market forces about to have their effect on the stock market later, then a wildcard event like the mine collapse would not necessarily have to be echoed in the movements of stock prices. So we can perhaps forgive the SP500 for not having a big dip to echo the BDI’s drop earlier this year. Now that the world shipping market is returning to normal again, the economic message is starting to work again too.
The past month+ has seen the BDI moving higher, and that suggests the SP500 has more upside movement yet to come, toward a price top due in about a month. The question is, will the strong recent correlation really work now?
That is a relevant question, given the history of this relationship. It really has not worked all that well in the long run, although it started working pretty well starting in around August 2017.

I wish I had a good answer to the question of why it really did not work all that well before August 2017, and also why it has correlated well since then. I do not have that answer, but I see that it is so. I also see that what lies ahead on this agenda is a big rebound by the BDI which is now due to get echoed by the SP500.
Tom McClellan
Editor, The McClellan Market Report
Dec 16, 2011
Baltic Dry Disputes China Collapse |
Apr 17, 2019
Lumber Gets Its Mojo Back |
Mar 08, 2019
Yield Curve Really Does Matter for Unemployment |