Bond CEFs Still Say Liquidity is in Trouble

Free Chart In Focus email
Delivered to you every week
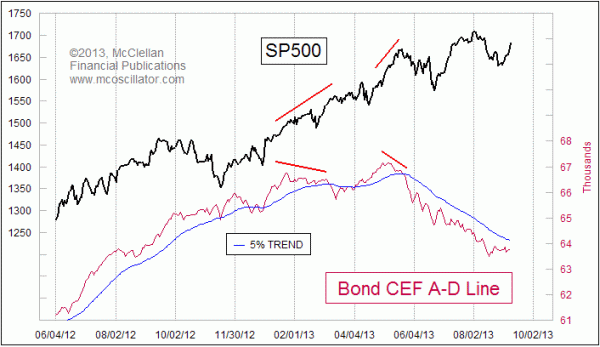
Earlier this year, the closed end bond funds were saying that the market was in trouble due to liquidity problems. That message continues even now without improvement, and provides a message to us that more trouble lies ahead.
There are a lot of analysts who are dismissive of the NYSE-listed issues that are not "common stocks". This is a prejudiced view, based on the assumption that issues which are not "real" stocks do not merit our consideration. But just as the canaries in coal mines a century ago were not real coal miners, there is information to be gained from these "uncommon" issues.
When there is a whole lot of liquidity to go around, it can spread out to even the least deserving of issues. In a period of constrained liquidity, the big cap piggies can still garner their share of the milk, while the runts go hungry. That is why it is useful to watch the health of the bond CEFs and the high-yield bond funds. They are the least deserving of issues, and as long as they are doing okay that means liquidity is not a problem. When they start to suffer, the message is that liquidity is getting tight, and the least deserving of issues are starting to suffer. Eventually such liquidity problems come around to bite the bigger capitalization issues, and that is why this is such an important item to keep watch over.
The SP500 bottomed on Aug. 27, 2013, and has bounced up 3.3% since then. But the bond CEF A-D Line has not shown any inclination to join in that rally. That says liquidity is not yet restored, even though the big-cap stocks can still mount a rally. The runts are going hungry.
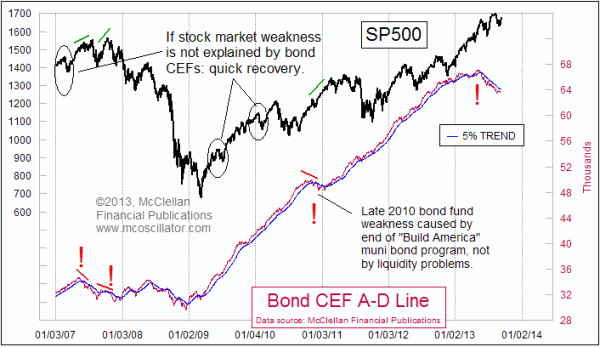
History shows that the periods when the bond CEF A-D Line is weak are periods when the stock market is in trouble. If there is a stock market dip which is not echoed by the bond CEF A-D Line, usually stock prices recover quickly. But signs of weakness in the bond CEF A-D Line can be a big indication of liquidity problems.
One big fat exception was the weakness we saw in the bond CEF A-D Line back in late 2010. That was attributable to a legislative change concerning municipal bonds, as the "Build America" muni bond program was ending. A lot of municipalities made a big rush to issue new debt to take advantage of that program, resulting in a flood of new issues that depressed the market for muni bonds.

That instance was not a sign of actual illiquidity for the overall stock market, but rather was a sign of an overly eager drinking from the well of muni bonds which was more than the market could handle. Once that government program's disruption of the market was over, things got back to normal.
The lesson is that when there is a government-induced disruption to the muni bond market, then once-reliable indications fall apart. Absent such a disruption, the behavior of bond CEFs remains a useful indication.
Thus far, the bond CEF A-D Line has not yet turned up above its 5% Trend (39-day EMA), nor even made a higher high. The message is that the 3%+ rally in the SP500 is not being fueled by raw liquidity. If it was, then the liquidity-sensitive issues would also be benefitting. But the bond CEF A-D Line says that the least deserving issues are not going along for the ride on this rally, and thus that it is a problematic one.
That could change, if liquidity suddenly returns to the financial markets and lifts the bond CEFs up to catch the big cap stocks. But so far that is not happening.
Tom McClellan
Editor, The McClellan Market Report
Apr 05, 2013
Bond CEFs Now Saying Liquidity Is In Trouble |
Oct 16, 2009
A-D Line Has the Story on Corporate Profits |
Jul 02, 2010
Liquidity Is Not The Problem |