Civilian Employment Level (Follow Up)

Free Chart In Focus email
Delivered to you every week
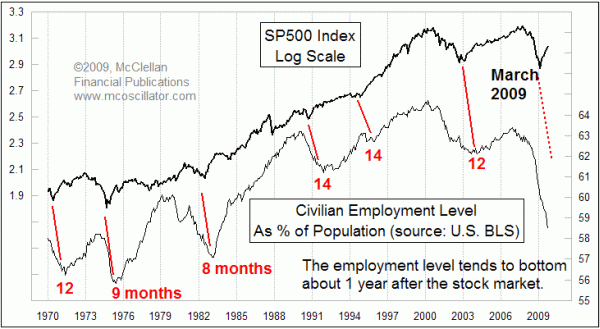
This week's chart takes a look back at one I featured on August 7, illustrating how the movements of stock prices tend to lead the job picture by about a year. We just found out on Friday, Nov. 6 that the unemployment rate in October jumped up to 10.2%, and overall civilian employment fell as well.
The data in the chart are as reported by the Bureau of Labor Statistics for the total number of people employed in the U.S., expressed as a percentage of the total population. This is arguably a more concrete measure of employment trends than other numbers. The non-farm payrolls number is the result of a survey of mostly large companies, so it leaves out small company activity. And the Unemployment Rate comes from the "household survey", which polls households to see who in the household is working, unemployed, retired, etc. Each survey methodology is subject to errors. For example, to classify people as "unemployed" involves evaluating whether or not they are actually looking for work, or are discouraged and no longer working. Some of these economic concepts can get fuzzy.
But if someone is employed, and if someone is alive, well those are pretty concrete types of status. This is why looking at this measure of employment can be so useful. And it also helps that the stock market acts as such a good leading indicator for it.
In the press, a lot of the coverage of the monthly employment report centers on whether or not it carries any reflection of the success of various government stimulus efforts. The question seems to be whether a continuing drop in total employed people means that the stimulus package has "failed". When thinking about that question, it is important to remember the message in this chart, which is that the normal circumstance is for total employment to bottom about 12 months after the stock market bottoms. The tops seem to be more coincident, but the bottoms for employment have that lag time after a stock market low.
It is still only 8 months since the March 2009 low, so for the jobs picture to be bottoming now would be very early. Any conclusion that some program "failed" to arrest the decline is dependent upon the premise that something COULD arrest the decline ahead of when it was scheduled to end. Given the weight of the evidence, and given all of the different ideas that officials have tried over the years to help influence the timing of changes in employment, one might think that they would have learned by now. But that assumes that those officials would actually be looking at the information which matters.
The civilian employment level should reach its bottom in March 2010, plus or minus a couple of months. No doubt, somebody will take credit for it then, but the real story is in the charts. The rapid nature of the rebound in stock prices implies a rapid rebound for jobs, at least at first. Whether that rebound is sustainable depends upon whether the stock market can remain aloft.
Tom McClellan
Editor, The McClellan Market Report
Sep 04, 2009 Unemployment Rate Rising On Schedule |
Dec 11, 2009 Final Dip Coming For Housing Market |
Aug 14, 2009 Gas Versus Oil: Who’s Right? |
Jan 15, 2010 Stock Market Repeating the Sideways 70s |