Commercial Traders Are Long Dollar Index Futures

Free Chart In Focus email
Delivered to you every week
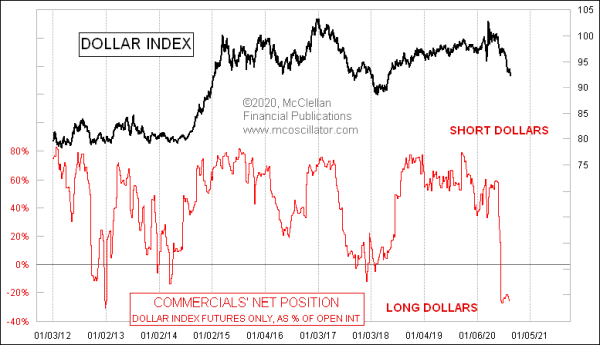
The big money “commercial” traders of US Dollar Index futures are holding a rare net long position as a group. They spend most of their time biased to the short side, and so when they move to a net long position, it is an unusual and thus interesting statement, indicating that the Dollar Index should be bottoming. The problem is, they are often early in adopting a large skewed position.
The weekly Commitment of Traders (COT) Report comes out every Friday from the CFTC, and reveals the positions held by traders, as broken down into 3 groups. The “commercial” traders are ones who use the subject commodity or financial futures item in their trade or business. So in the case of wheat futures, for example, Archer Daniels Midland or Cargill would obviously be considered commercial traders.
The next category is “non-commercial” traders, who are the large speculators. The small speculators are in the “non-reportable” category, because the number of contracts they hold is so small that the CFTC figures it is not worth bothering to track their positions individually.
Every futures contract is simultaneously one long position and one short position, held by different parties. The wheat farmer who sells his crop now for delivery 3 months from now is short, and the buyer of that contract is long. So there will never be a time when “traders” are more short than long. But it matters which types of traders are holding skewed positions in aggregate. In the case of the wheat farmer, if he thinks that wheat prices are going to rise between now and when he harvests the grain, then he will hold off from locking in prices. But if he thinks prices will fall, he’ll sell now and lock in his price.
Generally speaking, the commercial traders can be considered to be the “smart money” for most futures contracts, although that is a very broad generalization with many notable exceptions. For the purposes of this week’s chart, the commercial traders of Dollar Index futures are pretty reliable as a good indicator of where the value of the dollar is going, especially when they get to one of these rare net long positions. These net long situations do not come along very often, and when they do the Dollar Index is usually seen to rise in the months that follow.
The euro currency has a really large weighting in the calculation of the US Dollar Index, 57.6%. The next closest weighting is for the Japanese yen at 13.6%. So it really matters what the euro does in terms of how the Dollar Index behaves.
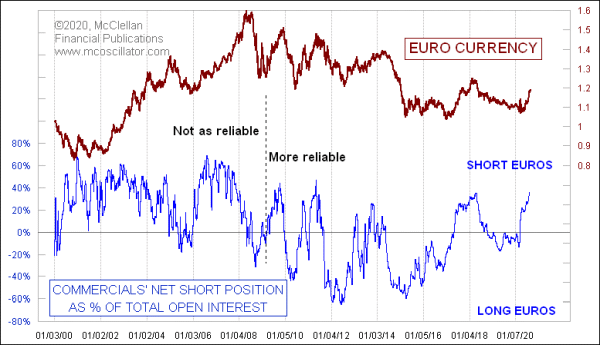
With that in mind, we are seeing confirmation of the notion of a rising dollar when we look at the COT Report data for the euro currency futures:

The commercial traders have been upping their net short positions (total shorts minus total longs) as a group as the value of the euro has been rising in 2020. Since 2009, such high net short positions have been good markers for a topping condition in the value of the euro.
Interestingly, this relationship did not seem to work very well before 2009. The euro currency only started being used and traded in 1999, and I do not have a good explanation for why this relationship did not correlate well during the earliest years of its futures trading. But it is working more reliably now.
The implications of a presumably rising dollar, which these indicators are calling for, would be greater purchasing power and thus lower price inflation. It would also likely have a depressing effect on gold prices. The Fed is statutorily mandated to try for “stable prices”, but a lot of Fed officials recently have been shamefully going against their own mandate, and calling for higher inflation rates. They ought to be fired, but that is a separate issue. A rising dollar as these indicators are foretelling is going to get those officials even more upset, and will give additional justification for keeping short term interest rates lower.
Tom McClellan
Editor, The McClellan Market Report
Sep 09, 2011
Gold Price is a Measure of Dollar’s Debasement |
Oct 13, 2017
Treasury-Bund Spread Says Dollar Has More Room to Fall |
Aug 17, 2012
Taking a Look at COT Data For The Euro |