Treasury-Bund Spread Says Dollar Has More Room to Fall

Free Chart In Focus email
Delivered to you every week
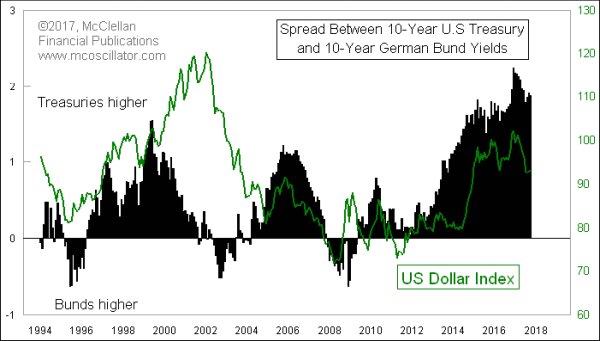
In Dec. 2016, the monthly closing spread between yields on U.S. 10-year Treasury Notes and the equivalent debt instrument from Germany was 2.24 percentage points, the highest reading we have seen since the 1980s. As the spread has started to contract, we have watched the US Dollar Index make its biggest drop since 2011.
Those German bonds are known as “bunds”, which is short for bundes which means “federal” in German, as in the Bundesrepublik Deutschland. This week’s chart shows that the Treasury-Bund spread is well correlated to the movements of the Dollar Index. That is important to understand as we contemplate the still-high value for that spread. In other words, the Dollar Index has a lot more room to fall as that Treasury-Bund spread heads back down toward parity.
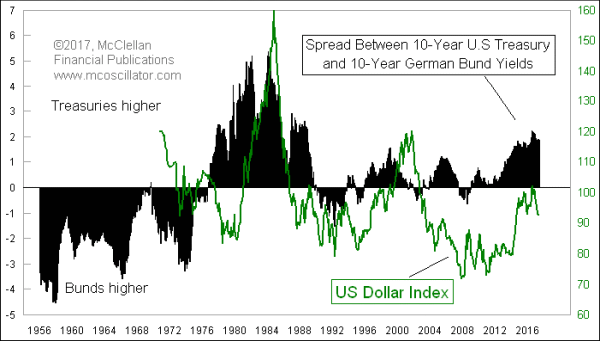
One point to understand is that the strong correlation between the Treasury-Bund spread and the Dollar Index is a phenomenon that only goes back to around the mid-1980s. The US Dollar Index was not even created until 1971, and in years prior the German mark was actually fixed at a 4:1 exchange rate. German mark coins were even made from coin blanks identical to the U.S. quarter. Germany also took a long time (understandably) to recover its economic strength after World War II, and so its debt understandably carried a higher yield for many years due to the default risk premium. Here is a longer term chart of that relationship, which allows us to see that the relationship did not work very well in the earlier years of the Dollar Index.

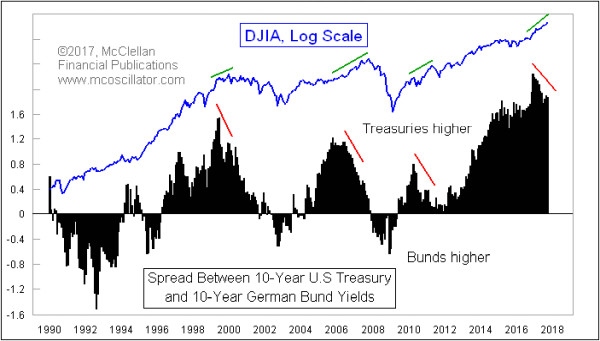
This big Treasury-Bund spread is not just a problem for the value of the dollar. Back in June, I wrote about how it also has an impact for the stock market. Here is an updated chart showing that comparison:

The divergence between the Treasury-Bund spread and the DJIA is now 10 months old and counting, but such divergences can last for a long time before they finally matter. The Treasury-Bund spread peaked in June 1999, which was 6 months ahead of the DJIA’s monthly closing high, and 14 months ahead of the August 2000 peak for the SP500.
There was another peak in the Treasury-Bund spread in June 2006, which was 16 months ahead of the DJIA’s final peak in October 2007. And a lesser divergence was seen in 2010-11, with the Treasury-Bund spread peaking in April 2010 which was 12 months ahead of the DJIA’s monthly closing high in April 2011, ahead of the post-QE2 price drop.
This is an admittedly small sample size for gauging how long of a divergence we should expect this time before the stock market finally turns down. But if we go with that range of 12-16 months, compared to the current 10-month duration of the divergence, then there should still be a few more months before the Treasury-Bund spread’s downturn finally gets echoed in stock prices.
Tom McClellan
Editor, The McClellan Market Report
Jun 30, 2017
Treasury-Bund Spread Gives Early Warning of the End |
May 12, 2017
China Is Pulling U.S. Bond Yields Higher |
Feb 23, 2017
Crude Oil Foretold the Trump Rally 10 Years Ago |