Congress Still Does Not Get It

Free Chart In Focus email
Delivered to you every week
Congress is fighting over whether to cut merely $70 billion out of discretionary spending or a full $100 billion. They evidently have no clue that they are just scratching the surface of the problem.
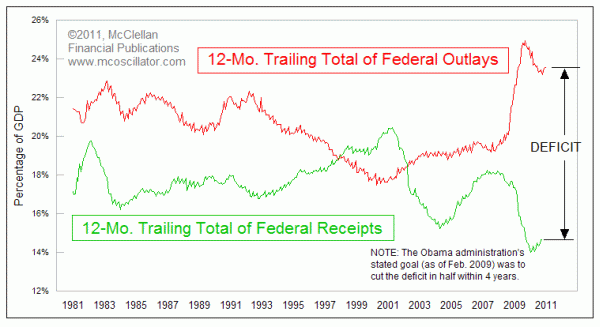
This week's chart looks at federal revenues and expenditures, each expressed as a percentage of GDP. Like most people I get confused when anyone starts talking about hundreds of billions or even trillions of dollars. So this way of looking at things puts it all into units I can make sense out of.
The economic slowdown which came out of the 2008 stock market and real estate collapse has pushed tax receipts down to the lowest level in years. At the same time, the various bailouts and stimulus efforts have pushed federal spending up to record highs. The huge spread between receipts and expenditures is the federal deficit, and for the past 12 months it stands at 8.6% of GDP. Of the money spent by Uncle Sam within the past year, more than a third of it has been borrowed.
There is a great web site for helping people track what is happening with the federal debt. http://www.usdebtclock.org/ has the relevant numbers and is continuously updated for moment to moment changes. For example, it lists current Debt Per Citizen as $45,499, but since that number goes up at a rate of $11/day, by the time you read this it will likely be a different number. Debt per taxpayer is a much bigger number.
There is an interesting window within the whole panel of constantly updating numbers, called "Largest Budget Items". Just out of curiousity, I took each of those 6 items and compared them to current GDP, just to see where the numbers are. Here is what I found:
Medicare/Medicaid 5.48% of GDP
Social Security 4.83%
Defense/Wars 4.75%
Income Security* 2.96%
Net Interest 1.37%
Federal Pensions 1.37%
*The "Income Security" category refers to: "Supplemental Security Income, Earned Income Credits, Unemployment Compensation, Nutrition Assistance, Family Support, Child Nutrition, Foster Care, Making Work Pay".
The total spending on just these 6 areas amounts to 20.8% of GDP. The current federal revenue only amounts to 14.9% of GDP. So just to keep up with those 6 biggest categories, we have to borrow 5.9 percentage points of GDP. And this is before we spend any federal money on highways, courts, law enforcement, NASA, air traffic control, border control, foreign aid, environment, education, etc. Total spending for the past 12 months is 23.5% of GDP.
It is worth noting that the highest rate of federal revenues ever seen was 20.7% of GDP when President Clinton was in office, and that amount was so high that it killed the tech boom and pushed the U.S. into recession in late 2000. In fact, every time total federal receipts have gone above 18% it has pushed us into a recession. So the solution cannot be to push tax collections up higher than the current 23.7% of GDP spending rate. It is not a survivable condition to do that, either for the economy or for those wishing to stay in power.
Congress won't succeed if it leaves the big 6 alone, and tries only to attack spending in the other areas that amount to the difference between 20.7% of GDP (in the big 6) and 23.7% overall. There is not enough meat in those 3 percentage points to get expenditures down far enough to match revenue. Fighting over $70 billion versus $100 billion in discretionary spending is chicken feed. To get to a balanced budget, Congress will have to go after the big 6, and that's hard. Do we not treat sick old people? Do we not pay pensions? Do we shrink Social Security checks?
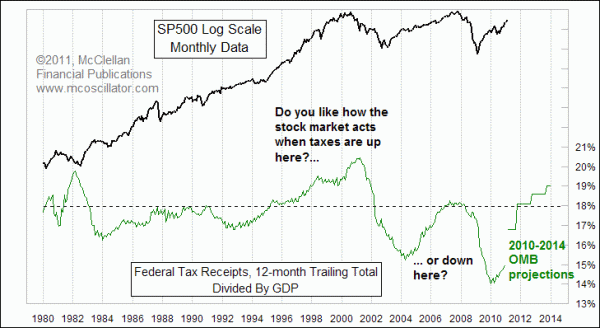
Or do we raise taxes? Remember that pushing up tax receipts above 18% of GDP leads to recessions (and generally, a new party dominating Congress). The chart below looks at tax receipts and the stock market. Stock prices do really well when the federal government takes in smaller percentages of GDP, leaving more money in the economy.

But leaving a big gap between receipts and expenditures drives up the debt, which is closing in again on the statutory debt limit. Earlier this month, Senators McCaskill and Corker announced a plan that would trigger automatic cuts if federal spending exceeds 20.6% of GDP. That means they are drawing a line in the sand at a point that is not even achievable from a tax collection standpoint without pushing us into another recession. They just don't understand the magnitude of the problem.
One factor which is helping at the moment is that the federal government is borrowing money at very cheap interest rates. The effective interest rate right now is just 1.4%. Once inflation returns as Fed Chairman Bernanke hopes, and the Fed pushes up short term rates to a more normal level, the amount spent on "net interest" will rise in a big way and make the whole deficit problem much worse.
For now, the important point for stock market investors to understand is that big spending and a low rate of tax collections as a percentage of GDP are great for pushing up the stock market. At the point when somebody in power decides to change that, in order to fix the problems described above, it is not going to be a pretty outcome.
Tom McClellan
Editor, The McClellan Market Report
Oct 29, 2010
POMO: The Hot New Timing Tool |
Aug 13, 2010
Brightening Prospects For Employment |
Apr 02, 2010
Lower Tax Collections Are Bullish for Stocks |