Consumer Sentiment Still Forecasts Employment Growth
Free Chart In Focus email
Delivered to you every week
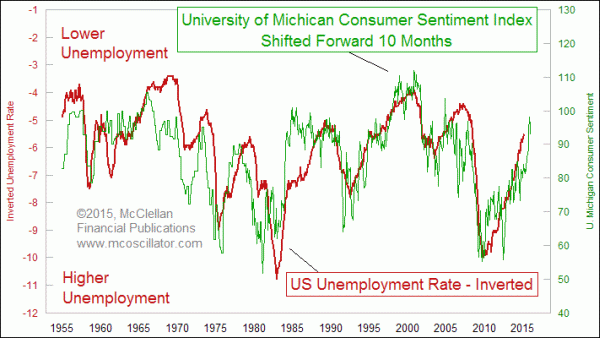
The unemployment rate has not finished falling. That is the message from the data provided by the University of Michigan’s Survey of Consumers.
In this week’s chart, I am comparing an inverted plot of the US civilian unemployment rate to the UMich sentiment data. It makes complete sense that how consumers are feeling should have a strong positive correlation to the unemployment rate. In a recession, when more Americans are out of work, it would be natural for consumers to be bummed out. So to find a relationship between them is not much of a surprise.
But there is nevertheless a surprise in this relationship, which is that the consumer sentiment data lead the movements of the unemployment rate. In order to get the two plots on the chart to line up with each other, I had to shift forward the UMich sentiment data by 10 months. That is another way of saying that the unemployment rate numbers follow in the footsteps of the sentiment data.
Saying it more plainly, consumers don’t respond to the unemployment rate when forming their opinions about the economy. It is the other way around. The economy only does well (and creates more jobs) after consumers have seen a turn in their attitudes.
Here is a closer look at the same relationship, zooming in on just the last 25 years:
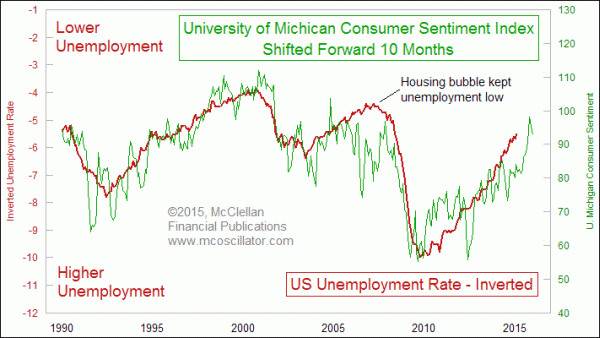
We can see some anomalous monthly readings in the sentiment data not being fully echoed in the (inverted) unemployment rate plot. Noise in data is not new. Back in the mid-2000s, there was an anomaly that amounted to something more than noise, when workers in the housing industry were building condos and single-family homes like crazy as part of the housing bubble. Once the housing market woke up and realized that condo-flipping was akin to tulip bulb flipping 400 years ago, the two plots came back together.
10 months ago, the UMich Survey of Consumers was at a reading of 81.3. It subsequently zoomed to 98.1 in January 2015, and currently sits at 95.9. So over the next 10 months, the unemployment rate data should roughly echo those movements in the sentiment data. That says we are not yet done with the current cycle of improvement in the unemployment statistics.
Tom McClellan
Editor, The McClellan Market Report
Aug 07, 2009
Civilian Employment Level |
Apr 09, 2010
Rydex Assets Levels Show Investor Sentiment |
Apr 16, 2015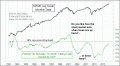
US Taxes Returning to Economy-Killing Level |