Rydex Assets Levels Show Investor Sentiment

Free Chart In Focus email
Delivered to you every week
When it comes to the overall stock market, I like to say that there are only 2 fundamental factors which matter. Forget earnings, book value, dividend yields, and all the rest of the fundamentals that are important for individual stock selection. For the overall market, the only 2 things that matter are:
1. How much money is there? and
2. How much does that money want to be invested?
Since the February 8, 2010 low, the stock market has been able to rise in a fairly smooth uptrend despite the fact that the overall money supply has been shrinking. According to the latest official government figures, the money supply measure known as M2 is actually down almost 1% since its Feb. 22 peak. The government no longer publishes the broader measure known as M3, but John Williams of Shadow Government Statistics calculates that M3 is falling at a year to year pace of 3.7%. Net of inflation, he says it is down an estimated 5.8%.
So if money supply matters for pushing up stock prices, and if money supply is shrinking, then how can stock prices be going up?
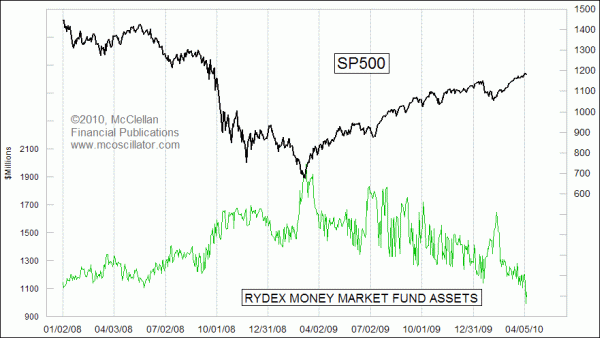
The answer lies in considering fundamental factor #2 above. Declining money supply can still push stock prices up if that money is getting more motivated to be invested in stocks. We can see that effect in this week's chart, which shows the total assets in the Rydex Money Market Fund.
The Rydex family of mutual funds is unique in that they publish the total assets invested in each of their mutual funds every trading day. Tracking the asset levels of certain funds over time can yield interesting insights about investor sentiment, at least as far as that sentiment is modeled by the behavior of investors who keep their money with Rydex (or with managers who use Rydex funds). Rydex is also unique in that it allows investors to trade into and out of any of their funds on a daily basis, whereas some other fund families like to restrict such trading. Subscribers to www.decisionpoint.com can track Rydex asset levels on that web site.
This week, the total assets in the Rydex Government Money Market Fund fell below $1 billion for the first time since February 2001. This is meaningful because investors tend to move out of equity-related mutual funds and into money market funds when they are feeling nervous about the future of the stock market. So a drop in money market fund assets can be a sign that investors are becoming more confident about market conditions, and thus are willing to abandon the presumed safety of the sidelines.
Looking at the chart above, you can see that the total assets level in the Rydex Money Market fund tends to fluctuate quite a bit, but when it gets to the top or bottom of its recent range it can signal a bottom or a top for stock prices. Higher levels in that fund show the nervousness that is typical of price bottoms, while low readings show that investors are feeling the confidence that is typical at price tops. Falling to a multi-year low conveys a big message about the level of complacency among the investing public.
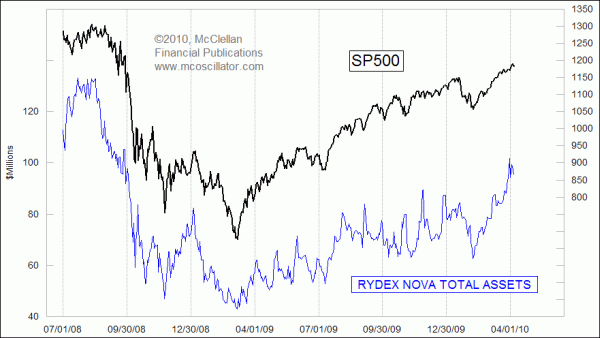
Similarly, the asset level in the Rydex Nova Fund shows outright confidence about the likelihood of higher stock prices. Nova was one of Rydex first mutual funds, introduced at the end of 1993 when Rydex was pioneering the new field of leveraged and inverse mutual funds. The Nova Fund tracks the SP500 with a 1.5 leverage factor, meaning that it is designed to move up or down each day by 1.5 times the percentage move seen in the SP500 Index. Investors move money into the Rydex Nova Fund when they believe that the SP500 is headed higher, and they tend to pull out of that fund when they believe stock prices are headed lower.

The recent readings for the asset level in Nova are the highest we have seen since September 2008, and thus they indicate a higher degree of investor confidence than at any time since the 2008 market meltdown. This confirms what we are seeing with the falling level in the Rydex Government Money Market Fund.
How all of this relates to money supply is that these fund flows reflect a change in the willingness of the available money to be invested in the stock market. That change has more than compensated for the falling money supply, but there is a limit to how far investors' collective willingness to invest can be changed. When equity funds reach multi-year highs of asset levels, and when money market funds reach multi-year lows, that is a sign that the motivation of investors may be reaching its limit. In other words, if people cannot get any more bullish, then they can only stay at that bullish level or get less bullish.
If we ever see a combination of falling money supply and declining willingness to be invested, then that will put a double-whammy of negative forces on stock prices.
Tom McClellan
Editor, The McClellan Market Report
Apr 02, 2010
Lower Tax Collections Are Bullish for Stocks |
Mar 26, 2010
Marking The Bottom For Housing |
Mar 19, 2010
10 to 1 Up Volume Shows Initiation |