10 to 1 Up Volume Shows Initiation

Free Chart In Focus email
Delivered to you every week
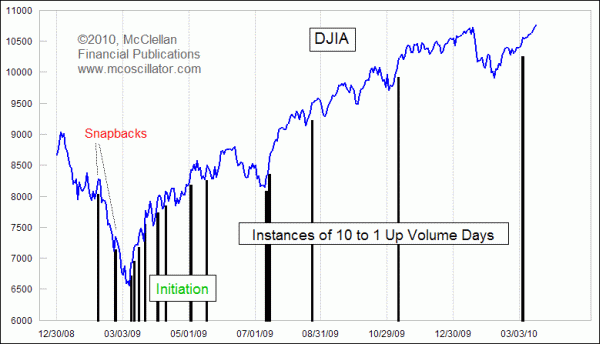
On March 5, 2010, the amount of Up Volume on the NYSE exceeded the amount of Down Volume by a factor of 13 to 1. That qualifies it as a "10-1 Up Volume Day", which has important implications for the future of stock prices.
In his 1986 book, Winning On Wall Street, Martin Zweig talked about 9-1 Up Volume days. The idea is the same, since every day that qualifies as a 10-1 Up Volume Day is by definition also a 9-1 Up Volume Day. Other technicians have also done a lot of work with these types of volume signals, and 10-1 Down Volume Days are also considered to be important events.
The basic idea about why these days are important is that to get the buying and selling skewed so far in one direction requires a lot of buying or selling pressure. Generally speaking, a 10-1 Up Volume Day that arrives in an uptrend is a sign that there is still more buying to come. It is a sign of great strength.
When you see one of these events in a downtrend, however, the meaning is usually different. During protracted downtrends, you can see big single snapback days, when a short-covering rally produces a lot of forced buying. We saw a couple of these 10-1 Up Volume Days on snapbacks in February 2009, when the market was still heading downward toward its March 9, 2009 bottom.
Right after that March 9, 2009 bottom, we saw a flurry of 10-1 Up Volume Days. The first one after the bottom might have been easily dismissed at the time as just another snapback rally, but when they start arriving in multiples then the context changes. The 10-1 Up Volume Days we have seen since that March 2009 bottom have occurred in the context of an uptrending market, and as such they are signs of buying pressure which should continue itself.
As an uptrend ages, these 10-1 Up Volume Days will become more scarce. They tend to concentrate more into the early phase of a new uptrend, when new buying pressure is at a maximum. That is useful information, because when you see a concentration of such days it is a message that the market is at the beginning of a new sustained uptrend.

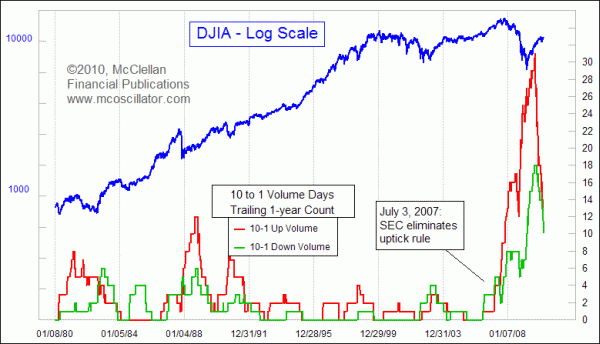
It is also interesting to note that we have recently seen far more of these 10-1 Up Volume Days than is typical. Part of that has to do with some structural changes to trading rules within the financial markets. After the "uptick rule" was abolished in July 2007, there was a big increase in 10-1 days, both upward and downward.
The meaning of a 10-1 Down Volume Day (not shown) is nearly always different. Rather than signaling initiation to the downside, a 10-1 Down Volume Day is usually exhaustive, and is a sign of a short term bottom for stock prices.
The most recent 10-1 Up Volume Day on March 5, 2010 said that there was strong initiation upward, and that we should expect additional upward continuation. That's exactly what has happened over the 2 weeks that followed, but with the overbought condition that has developed, that continuation signal should be viewed as having reached its expiration date.
Tom McClellan
Editor, The McClellan Market Report
Oct 30, 2009
A-D Line Back Near All-Time Highs |
Oct 16, 2009
A-D Line Has the Story on Corporate Profits |
Mar 05, 2010
NYSE’s New Highs Confirm Uptrend |
Aug 21, 2009
Strong RASI Promises Higher Price Highs |