FOMC Announcement Days Tend To Close Up
Free Chart In Focus email
Delivered to you every week
Fellow market analyst Rob Hanna noticed something interesting several months ago, and reports on it regularly in his blog. He noticed that the stock market tends to close up more often than not on the days when the FOMC meets and announces its decisions about monetary policy. Sometimes the FOMC meets for 2 days at a time, so the second day is used for this purpose since that is when the announcement comes.
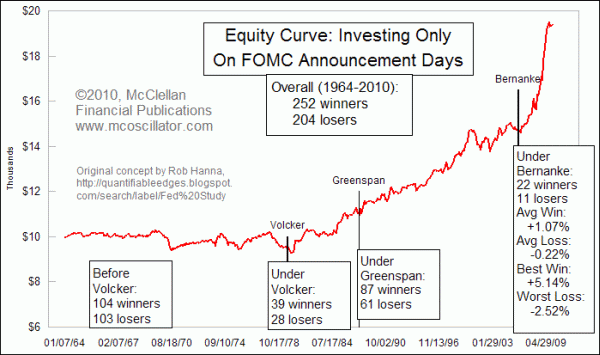
This week's chart shows what the equity curve would look like if you had started with $10,000 back in 1964 and only been invested in the SP500 on the days of these FOMC meeting announcements. That is a ridiculous idea for a trading system, but it is a useful method for seeing the effect of something like these FOMC announcements. It is an appropriate topic to examine now, because the next FOMC will be meeting on Tuesday, March 16, 2010.
Using an equity curve is a meaningful way to examine this because it not only factors in the direction of price movement but also the magnitude. It goes upward if there are more up days than down days, and also if the size of the up days exceeds the magnitude of the down days.
Interestingly, prior to Paul Volcker taking over in 1979, there did not seem to be much of an effect on the stock market. That was in part because the Federal Reserve did not issue any announcements decades ago about monetary policy, and investors had to guess about changes. We should also remember that back in the 1960s, there were no rapid mechanisms for dissemination of this sort of information. A stenographer would have to record the meeting in shorthand, then hand the notes to the typing pool where typists would type up the notes from the meeting, using carbon paper for multiple copies.
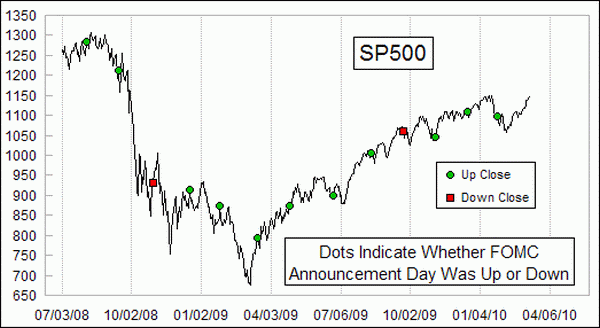
Precisely why a change in the market's behavior started during Paul Volcker's years is not entirely clear, but ever since his term there has clearly been a positive bias. And it has gotten even more positive under Ben Bernanke, with up days outnumbering down days 2 to 1 on the days of the post-meeting announcements. And since July 2008, there have been 11 up closes versus just 2 down days. That is a pretty strong tendency.
Looking deeper at these events, I find less correlation between the direction of the close on the announcement day and what happens next for the market. There just is not a reasonable set of past events from which to say, "If the market is up on the FOMC day, then...." The outcomes are too variable. The market action following an FOMC meeting tends to correspond more to what was happening beforehand, as these meeting days can sometimes mark reversals for short term trends. So since the trend leading up to the March 16, 2010 meeting has been upward, we just might see a rare downward reaction from the stock market.
Tom McClellan
Editor, The McClellan Market Report
Sep 04, 2009
Unemployment Rate Rising On Schedule |
Nov 27, 2009
Why You Should Fear A Balanced Budget |
Mar 05, 2010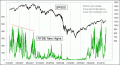
NYSE’s New Highs Confirm Uptrend |
Jul 31, 2009
Spread between 2-year yield and FF rate |