Marking The Bottom For Housing

Free Chart In Focus email
Delivered to you every week
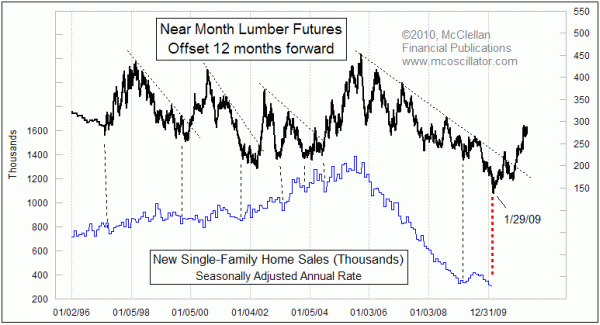
The latest data (January 2010) for new home sales showed a slight dip versus the December 2009 numbers. This came as a surprise to many analysts but not to me. I have been looking forward to a January 2010 bottom for the housing market, based on the leading indication given by lumber prices.
In this week's chart, lumber prices are shifted forward by 12 months to reveal the leading indication for new home sales. The ebb and flow of liquidity through the economy affects both the supply and demand for housing, and those forces are revealed a year ahead of time in lumber prices. Lumber also works great as a leading indicator for short term interest rates, so the doubling of lumber prices over the past year is a statement that we should expect the Fed to raise short term rates soon. The members of the FOMC might not know that they are going to be raising short term rates, but lumber knows.
This technique of time-shifting of price data is the subject of our Liquidity Waves DVD.
Lumber futures prices hit an all time low on Jan. 29, 2009 at $138.10 per 1000 board feet. So adding 12 months to that date, we get January 2010 as the idea bottom for new home sales. There can be slight variations earlier or later than the ideal times forecasted by the movements of lumber prices, but we are pretty close to the bottom.
We will not see confirmation of a housing bottom for several more months. It will take some time for more months of data to come in, and show a rise in sales volumes. There is also a lag in the reporting of these data; the January new home sales data were just released on March 24, and home price data takes even longer to be tabulated and released.
New home sales is a better measure of housing demand than existing home sales because of who the buyers are. Typically, the buyer of a newly built home is the end user, and not someone buying it on speculation that he can sell it for more. That "rule" got bent a bit by all of the condo flippers during the real estate bubble, but that game wiped out many of its players.
The plentiful supply of existing homes has attracted the real estate speculation crowd, who are buying up bank foreclosures and other distressed properties. So those players are not much of a factor in the new homes market. This means that at the point when we see new home sales start to improve, we'll have confirmation that this aspect of the economy is starting to improve in a real way, meaning greater demand from the end users.
Looking closely at this week's chart, we can see that the rise in lumber prices off of the Jan. 29, 2009 low made an initial up move into the summer of 2009, just barely penetrating the long declining tops line. Technicians would call that a "failed breakout", as there was not sufficient energy in the up move to prosecute the breakout. Lumber prices fell back down to another low later in 2009, and then subsequently made a successful breakout move. So we can expect that home sales may see a similar "double dip" before the real improvement becomes noticeable in early 2011.
This implies that any general economic improvements we see in the first half of 2010 may stumble a bit later in the year, which will make things extra interesting when the mid-term elections come around in November 2010.
Tom McClellan
Editor, The McClellan Market Report
Dec 11, 2009
Final Dip Coming For Housing Market |
Nov 06, 2009
Civilian Employment Level (Follow Up) |
Aug 28, 2009
Lumber Says Economic Slowdown Not Complete |