Covid-19’s Effect on CO2 Levels
Free Chart In Focus email
Delivered to you every week
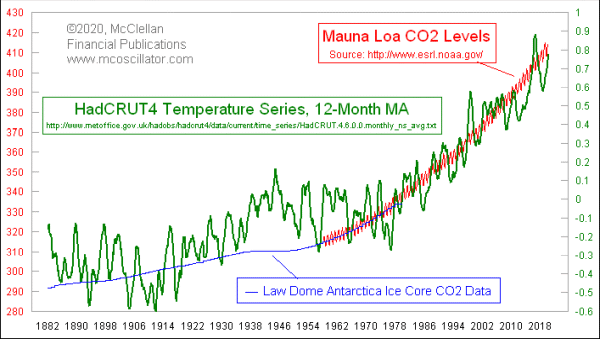
Climate scientists are anxiously awaiting more data to see how the global Covid-19 shutdown will affect climate data. One key is to look at CO2 numbers, which have been rising for centuries, but more earnestly since 1950.
The coincidence of the rising CO2 and temperature plots is what makes a lot of people believe that CO2 is the driver of temperature.
One challenge for identifying the CO2 response to the Covid-19 economic shutdown is that there is a big annual seasonal factor in the CO2 data. Trees in the northern hemisphere soak up CO2 in leaves during the summer, then they fall and decay in the winter. CO2 levels usually peak in May, and bottom in September or October. So almost half the time, CO2 is falling. But the trend is upward.
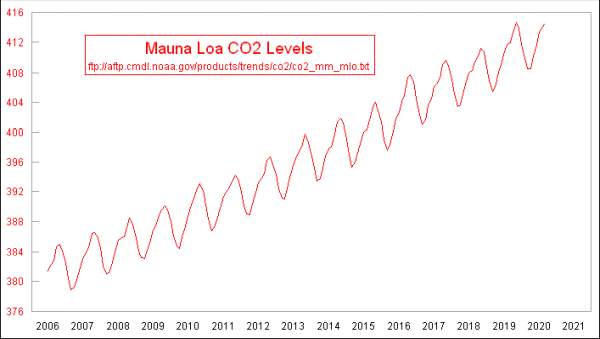
The value for the March 2020 CO2 level at Mauna Loa was 414.50 ppm. But how does that fit into the recent trend? Here are March numbers for the past few years:
March Change
CO2 From Feb.
2013 397.43 0.63
2014 399.77 1.76
2015 401.54 1.26
2016 404.87 0.75
2017 407.22 0.76
2018 409.41 1.09
2019 411.97 0.22
2020 414.50 0.39
If we are really seeing a global economic slowdown, with an accordant drop in energy use and CO2 discharge, we should see a very low number for the change from February. March 2020’s change from February is kind of low, but still positive.
So that seems like Covid-19 really is having a bit of an effect on global human output of CO2. Hurray for the climate warriors!
But human energy use is only one of the drivers of CO2 changes. Land use is important, and perhaps even more important is what temperatures are doing. Yes, that’s right, temps drive CO2, instead of the other way around.
Why would this be? Part of the answer is that water (like in the ocean) absorbs and holds more CO2 when it is cold. That sounds counterintuitive, since warm water can dissolve more sugar or salt, for example. But any chemist will tell you that gas absorption rules in liquids are funny. So if the ocean gets warmer, it cannot hold as much CO2.
Thus, if you heat the planet (or if the variable output of the sun does), the ocean won’t hold as much CO2. And more of it will go into the atmosphere where it will get measured at places like Mauna Loa.
But the effect is not immediate. Here is a chart comparing the HadCRUT4 global temperature series to the annual change in CO2 levels. The key insight is that the HadCRUT4 plot is shifted 4 months forward.
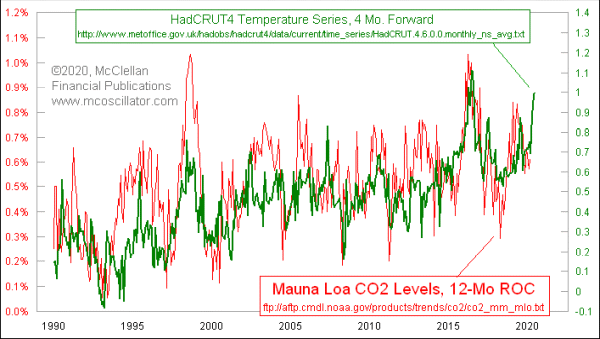
What it shows is that rising and falling temperatures are followed about 4 months later by rising and falling rates of change in the atmospheric CO2 levels.
The March 2020 annual CO2 ROC (red line) value of 0.61% is not much different from the baseline rate over the past few years. And the recent dip over the past few months matches a slight dip in global temperatures.
Looking forward, a new recent surge in temperatures says we should see an echo in the CO2 levels. Saying it more plainly, CO2 levels should start rising rapidly, irrespective of what the Covid-19 shutdown may have done to energy usage and CO2 discharge rates.
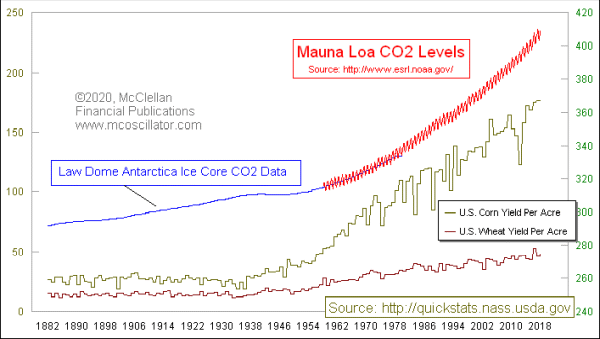
But that is not necessarily a bad thing. Rising CO2 levels have coincided with rising crop yields. Plants consume CO2, and they grow better as levels are higher.
But, the alarmists say, if we keep increasing CO2 levels, we’ll warm the planet too much, causing more severe storms. The reality, however, is more complicated. Here is a comparison of global temperatures to the Atlantic basic ACE Index, which is a measure of how much energy is contained in hurricanes and tropical storms:
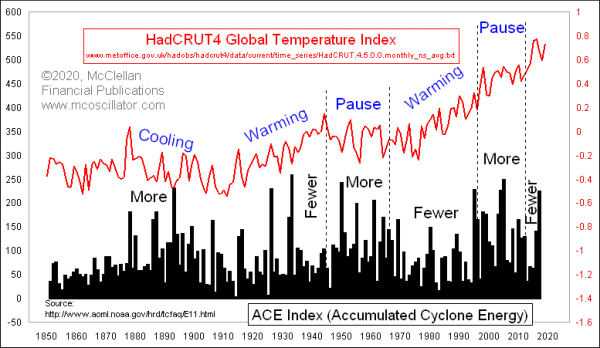
What it reveals is that hurricanes tend to be more severe during the multi-decadal cooling phases. When we go through a warming phase, hurricanes tend to simmer down.
So if the alarmists could have their way, and get us to go to negative CO2 emissions and a long cooling trend for temperatures, that would mean going through a long period of more hurricane energy (which happens during the cooling phases), and decreasing fertilization of cereal crops. Those would not necessarily be good outcomes to pursue.
Fortunately, we are not likely to see that happen. Shutting down the global economy for Covid-19 was not enough to bend the trend for CO2 lower in March 2020. And the public has been offered a glimpse of what the world would be like under the oppressive restrictions on economic activity which the climate alarmists want to put us through. The public does not like it much. So the Covid-19 experience is likely to dampen enthusiasm for imposing onerous restrictions on energy use and economic activity.
Tom McClellan
Editor, The McClellan Market Report
Aug 17, 2017
Warm Temperatures Mean Lower Inflation, To a Point |
Jul 07, 2016
NIRP Disrupting 60-Year Cycle |
Nov 12, 2010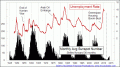
The Secret Driver of Unemployment |