Crude Oil COT Report Data
Free Chart In Focus email
Delivered to you every week
After a long price decline which started from a top back in June 2014, crude oil prices finally appear to be attempting to construct a bottom. And perhaps equally important for that process, sentiment also seems to be developing in the right way to get a price bottom.
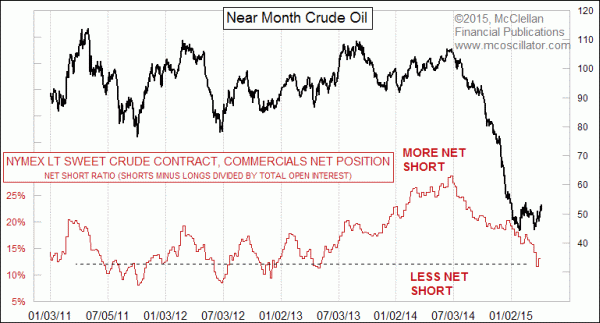
This week we are looking at data from the CFTC’s Commitment of Traders (COT) Report, something that I feature every week in our Daily Edition. The chart above depicts the net position of the commercial traders of NYMEX crude oil futures. One point worth stressing right from the beginning is that these big money (and thus presumably smart money) traders have been continuously net short ever since mid-2009. So the game consists of evaluating their current position as a group compared to recent values, as opposed to some empirical pre-conceived idea about where “high” and “low” ought to be.
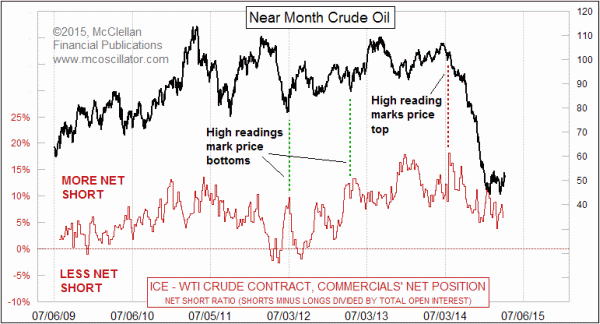
It has been 2 years since the commercials have been down to this low of a net short position, and that instance marked a very important low for crude oil prices. Other prior instances of this sort of reading also were associated with important lows.
How important of a low, and how much of a price increase we might see, are not items which these data will tell us. All we know for sure is that the big money traders no longer think that they ought to be short crude oil futures as much as they used to. Back in early July 2014, these same commercial traders were at an all-time high net short position, correctly betting on a big price decline. Now they are back down to where price bottoms are seen.
I should stress that within the weekly COT Report, there are actually two different contracts included for US crude oil, plus Brent, Canadian heavy crude, some swaps, plus propane, gasoline, natural gas, and a bunch of other energy contracts. But focusing on just crude oil futures for now, it is important for analysts tracking the COT Report data to look at the right contract. By that, I mean the NYMEX Light Sweet Crude contract whose data are shown above.
The other US crude oil contract in the COT Report is known as “Crude oil, Light Sweet-WTI – ICE Futures Europe”, and it is traded on the Intercontinental Exchange. I would advise everyone to not even look at the COT data for that contract, because it is just goofy and misleading. Here is what I mean:
As you can see, sometimes this data correlates positively with prices, sometimes inversely, and sometimes not at all. It is wholly unreliable in terms of giving useful insights about where prices might go. I have no idea why this would be, that one contract is useful and reliable, and the other is useless. But one does not need to know why something correlates poorly in order to recognize that it does.
So if you see charts of COT data for crude oil elsewhere, make sure you look closely to make sure what contract(s) are being portrayed, and what conclusions the provider of such charts may be offering. If it is the NYMEX contract, then sometimes you can get useful insights when it goes to an extreme, like what we are seeing in the top chart. If it is the ICE contract, set it aside and forget about it.
Tom McClellan
Editor, The McClellan Market Report
Feb 12, 2015
Crude Oil Leads the Euro |
Oct 09, 2014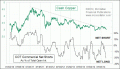
COT Data Show A Bottom For Copper |
Jun 19, 2014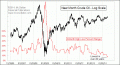
Crude Oil Abnormally Quiet |