Crude Oil Swooping Up On Schedule

Free Chart In Focus email
Delivered to you every week
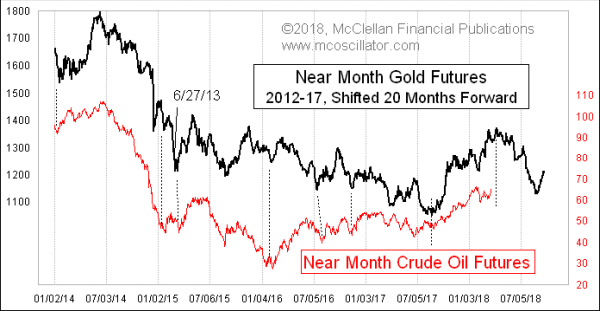
The movements of gold prices lead similar movements in crude oil about 20 months later. So if you watch what gold has already done, you can see the script for what oil prices are going to do.
It does not work perfectly; it is merely amazing, not perfect.
Crude oil prices had a brief swoon, dipping to $59/barrel in early February. That matched a brief dip in gold prices 20 months earlier in May 2016. Now oil prices are recovering, just as gold recovered to its July 2016 top. But the recovery in oil prices should only be a brief one, as gold’s chart plot shows a big decline ahead for oil prices.
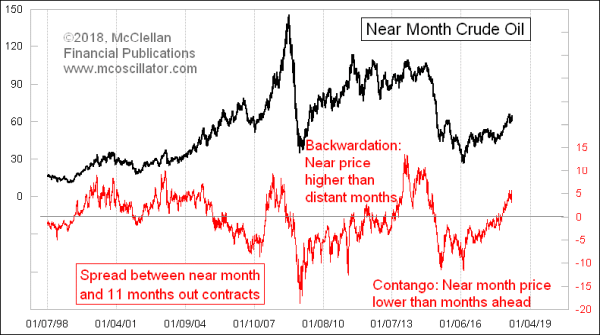
There is agreement in this next chart for that thesis that oil prices are headed lower.

Right now, the near month contract is around $64, but if we look out a year then we see distant month contracts at $59. That’s the crude oil futures market saying that the near month prices are too high, a condition known as “backwardation”. And it tends to lead to lower oil prices in the months which follow, just like gold says should happen.
Tom McClellan
Editor, The McClellan Market Report
Dec 08, 2017
Conflicting Messages for Crude Oil |
Nov 02, 2017
Crude Oil Backwardation |
Dec 24, 2014
Oil Follows Gold’s Crash Pattern |