Conflicting Messages for Crude Oil

Free Chart In Focus email
Delivered to you every week
I like it best when all of my indicators agree, but I don’t get to enjoy that condition very often. This week, I have conflicting signs for the future of crude oil.
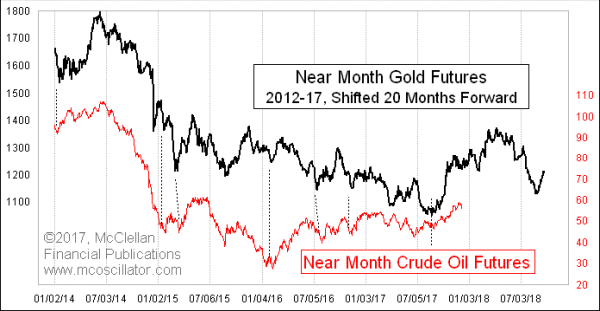
The chart above shows gold’s leading indication for crude oil prices. The offset is currently running at about 20 months; it has been as low as 11 months in past years. The basic idea is that the movements of gold prices tend to get repeated in crude oil prices.
I call this phenomenon “liquidity waves”. Think of a wave that passes under the end of a pier. That same wave later reaches the beach, and so if you know how long it takes for a wave to travel, you can foretell the wave hitting the beach by seeing it at the end of the pier.
For oil and a few other price series, gold is that guy out on the end of the pier, watching the waves come in. Gold correctly foretold the up move we have seen in crude oil prices from the summer 2017 low. Now the second part of the up move that we saw in gold prices 15-20 months ago is about to hit crude oil prices, if the relationship works right. That should mean an uptrend for oil prices to around the end of March 2018.
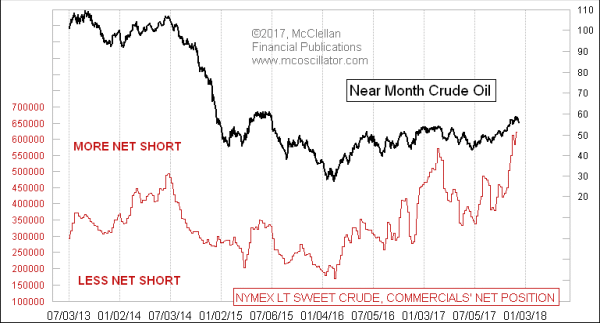
But conflicting with that forecast is what we see currently in the COT Report data, where the big-money “commercial” traders are holding their largest raw net short position in the history of the light sweet crude oil contract.

They have been continuously net short to varying degrees since 2009, and so the game consists of evaluating their current net position as a group relative to recent readings. High net short positions like this one have been reliably associated with important price tops for crude oil futures.
So how can we reconcile this pair of conflicting expectations? One way is to turn back to that top chart, and note that gold’s price plot shows the thrust upward toward the top due in March/April 2018 for crude oil begins from a low equating to late January 2018. So the uptrend in oil prices which gold is calling for really does not have to get started for another couple of months, assuming that oil matches gold’s dance-steps exactly. That leaves some time for the commercial oil futures traders to turn out to be right about needing to have a bit of a price pullback over the next couple of months.
The takeaway is that if you want to catch the big up move coming for oil prices, you have some time to wait first as oil prices put in a bottom to go up out of. And when that rally comes for oil prices, don’t get too cozy in a long position, as gold’s message is one of declining oil prices into the summer of 2018.
Tom McClellan
Editor, The McClellan Market Report
Nov 02, 2017
Crude Oil Backwardation |
Mar 10, 2017
Huge Imbalance in Crude Oil Positions |
Jul 06, 2015
Gold Shows Real Reason for Oil’s Dip |