QQQ Volume Gave Us a Tell

Free Chart In Focus email
Delivered to you every week
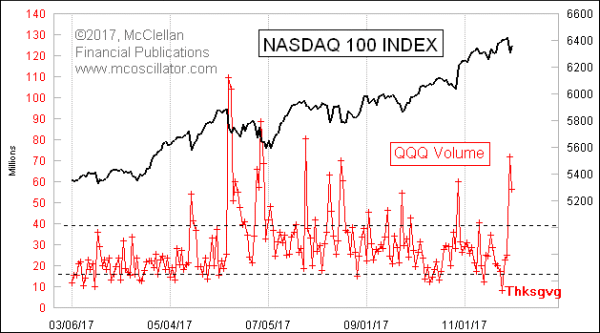
The high volume seen in QQQ on a recent selloff was a signal that short term bearish sentiment had gotten overdone.
The tech selloff on Nov. 29, 2017 was a peculiar one, as it was not echoed elsewhere in the market. Instead, we saw the FANG and semiconductor stocks down hard, but the DJIA was actually up on the day. And then the next day, all of the indices were up strongly, as if whatever was worrying tech investors on Nov. 29 was magically all over. The high volume in QQQ was a sign of a concentrated moment of panic, which evidently washed itself out all at once.
Anyone who has read Edwards and Magee’s Technical Analysis of Stock Trends knows that volume confirmation of price action can be an important analysis tool. But volume works differently in the big ETFs like QQQ or SPY.
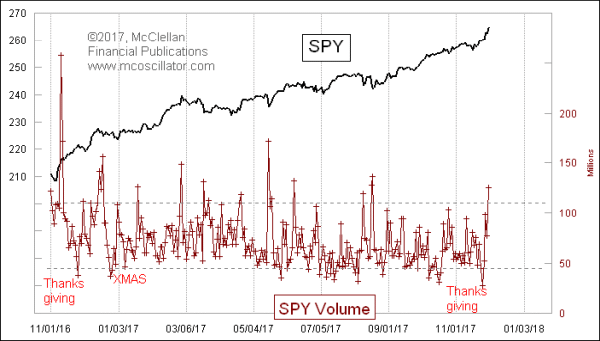
High volume days in those ETFs signal excessive worry among traders. This comes from two sources. One is traders turning to the big ETFs instead of individual equities in times of peril because they believe that the ETFs are more liquid. And another source of trading volume on those big days is from traders using the big ETFs as shorting vehicles, to hedge market exposure in their other holdings. So when we see these high volume days, they are markers of acute bearish sentiment and they usually mark meaningful price bottoms.
Low volume days can sometimes mean the opposite, showing excessive complacency that can be a marker of a price top. But caution must be employed with interpreting low volume days, because volume can sometimes be suppressed for other reasons, such as major holidays.
The same principle also works with volume in SPY:

SPY’s volume can sometimes be elevated around quarterly option and futures expiration days, as the shares of that ETF get traded as part of the exercising of those options, so some caution is merited in interpreting high volume days then. That effect does not seem to be much of a factor for QQQ though.
Tom McClellan
Editor, The McClellan Market Report
Feb 09, 2017
Low QQQ Volume a Sign of a Top |
Dec 22, 2016
SPY Assets Zooming Higher |
Jul 02, 2015
QQQ Volume Spikes on Selloff |