Gold Shows Real Reason for Oil’s Dip

Free Chart In Focus email
Delivered to you every week
Crude oil prices had been hovering around the $60/barrel level since late April 2015, seemingly held at a quiet hover. But it has just recently broken its hold on that price level, with a move downward that has been attributed to the economic uncertainty in Greece.
This is a classic case of the news media seeing a price event, and seeing a news story at the same time, then concluding that the two must be related. My explanation is different: oil is dipping now because that is on the script that oil prices have been following for the past several months.
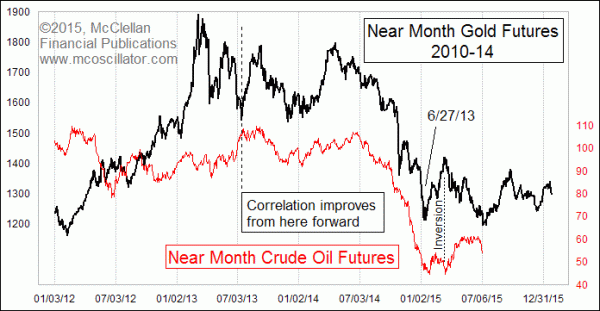
That script was first recorded by gold prices back in 2012-2014. I first took a look at the comparison shown in this week’s chart after noticing that the dramatic decline in oil prices during 2014 felt a lot like the sharp decline in gold prices during early 2013. But “felt” is not a very scientific way of looking at the world, so I put them together on the chart to better compare the price patterns.
Oil prices seem to have fallen into step with gold’s earlier pattern beginning around July 2013. Before then, the patterns do not correlated all that well. I do not know what event might have precipitated that action of the price pattern starting to resemble gold’s earlier pattern, and I must confess that I could not have imagined back in 2013 that this was what was taking place in the oil market. It took the ugly price decline by crude oil in 2014 to make me go hunting for the correlation.
Shortly after I uncovered this relationship and wrote about it, oil prices seemed to undergo an inversion relative to gold’s price pattern. That sometimes happens with price pattern analogs like this, and perhaps the inversions exist just to help throw us off the scent. But now oil appears to have fallen back into step with gold’s pattern, and is making this current oil price drop right on schedule.
If the pattern analog’s correlation continues into the future, and that is always a big “if”, then we should expect to see oil prices bottom very soon, and then start rising over the next 3 months. I have no doubt that the financial news media will then look around at whatever news stories develop and declare that those news stories are the cause of oil’s upcoming price rise. But those of us who can see the repeating rhythms of market price behavior will know different.
Tom McClellan
Editor, The McClellan Market Report
Dec 24, 2014
Oil Follows Gold’s Crash Pattern |
Dec 12, 2013
A Review of Analogs |
Aug 29, 2013
Gold Says Wheat Prices To Drop |