Drop in inflation should bring DROP in crime
Free Chart In Focus email
Delivered to you every week
In his book, "The Tipping Point", Malcolm Gladwell makes the argument that the drop in crime in New York City during the 1980s was brought about by then-Mayor Rudy Giuliani's increased emphasis on little things, like making building owners clean up graffiti, or fixing a broken window. The hypothesis is that seeing such signs of decay as those made people think that engaging in criminal activity was socially okay, and so reducing or eliminating those factors brought crime to a "tipping point", causing it to fall dramatically.
In their book, "Freakonomics", authors Stephen Dubner and Steven Levitt make a different argument to explain the drop in crime, citing unique demographic trends in the US population for the nationwide decline in crime rates during the 1980s and 1990s.
I have a different explanation to offer:
Crime is the Fed's fault.
This week's chart shows that the robbery crime rate for the overall U.S. is well-correlated to inflation, with one catch: the inflation rate data is shifted forward by 1 year. Without that shift, the correlation is not quite as good. The clear implication is that changes in the crime rate follow changes in the inflation rate with about a one-year lag.
Interestingly, the same correlation also works when we look at overall US crime, as well as New York City crime. Sorry Rudy, but it wasn't the broken windows.
We do not yet have the final tally for crime rates in 2009, but we have anecdotal evidence pointing to an increase. An October 2009 Gallup Poll survey found that 74% of Americans say there is more crime in the US than there was a year ago. That poll response is up from a reading of 67% a year earlier. That survey also found that 51% say that there is more crime in their areas now than a year ago, which is the highest reading for that question since 1992. So if people's perceptions are any indication, 2009 should probably record an uptick in crime rates as the inflation model suggests.
But in spite of still-high unemployment, 2010 should see a dramatic decline in crime, as an echo of the drop-off in inflation that we saw in 2009 following the oil blowoff of 2008. It does not necessarily make sense that crime should go down with unemployment going up. Some social scientists would argue that rising unemployment leads to greater desperation and thus more motivation for committing crimes.
Here again, a look at the actual data can be more illuminating than theoretical supposition. It is interesting to note that some of the most famous criminals reached their zenith in the early 1930s. Al Capone got convicted in 1931, then there was a bit of a lull in the famous crimes until Bonnie and Clyde plus John Dillinger came along in 1933. They got taken down in 1934, at the height of their crime sprees. It would make sense to argue that the desperate times of the Great Depression were responsible for a big rise in crime, but once again there is another explanation.
We don't have actual crime rate data going back that far, but we do have Warren Beatty and Faye Dunaway to help us remember what it was like (and Johnny Depp as Dillinger). The famous crime sprees in 1933-34 followed a spike in the CPI inflation rate, from its low of -10% (actual deflation) in 1932 to above +5% in early 1934. Then too, crime followed rising inflation.
Coming back to the present, the big drop in the inflation rate during 2009 suggests that the crime rate in 2010 should see a big drop. But if all of the Fed's money printing since the September 2008 Lehman collapse does what I think it will do, we will see a big rise in inflation in the coming months. Then about a year after the inflation rebounds, we should once again see a corresponding rise in the crime rate.
Tom McClellan
Editor, The McClellan Market Report
Jan 15, 2010 Stock Market Repeating the Sideways 70s |
Feb 12, 2010 Birth Rate and the Stock Market |
Jul 17, 2009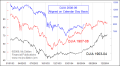 Panics We Have Seen Before |