EEM Leading The Way Higher

Free Chart In Focus email
Delivered to you every week
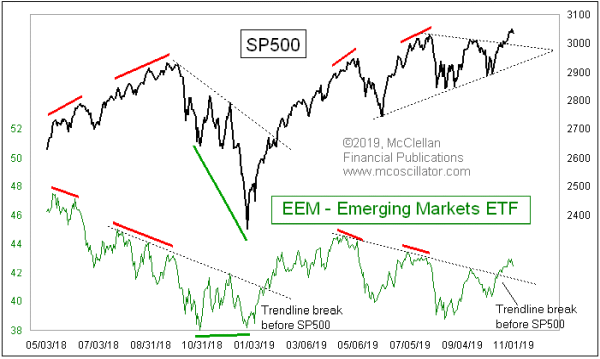
The SP500 has now finally broken out above its declining tops line, and closed at a new all-time high. Whether it could do so was in doubt for a while, but we had a strong hint that it was coming from this week’s chart. It shows a comparison between the SP500 and EEM, the big emerging markets ETF sponsored by iShares.
EEM has the really fun property that when it disagrees with the SP500, that is usually really useful information. When there is a divergence or other disagreement, EEM usually ends up being right about where both are headed.
The hint which EEM gave us recently was in the form of breaking its own declining tops line ahead of the SP500 breaking its downtrend line. It did this same thing coming out of the Dec. 2018 bottom, and in that instance it had also shown a bullish divergence versus the SP500 by making a higher low.
EEM is very heavily weighted in Chinese stocks. According to the iShares page for this fund, 5 out of the top 10 holdings are companies based in China, plus Taiwan Semiconductor is based in Taiwan. So the fortunes of those companies and of EEM’s share price depend a lot on how investors are feeling about the prospects for a trade deal. They are also very liquidity-sensitive issues.
While the SP500 is bursting out to new all-time highs, EEM is still a long way from achieving that. So a casual chartist might say that this represents a massive divergence with huge macro implications for world stock markets. But in my observations, that is not the period over which divergences between these two seem to matter. The better divergences for analytical purposes are the ones arising over a period of just a few weeks to a couple of months.
With EEM having led the way higher in October 2019, that was a good sign to expect the breakout we saw in the SP500. And so far, there is no bearish divergence forming yet.
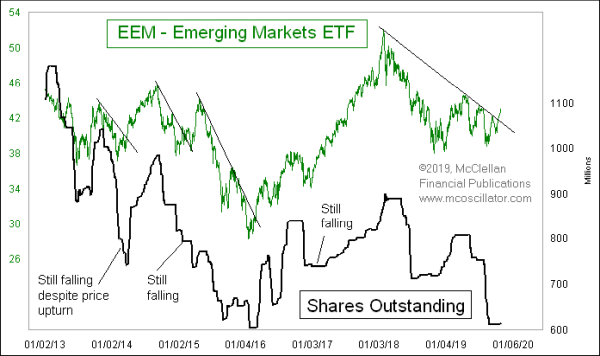
One additional reason to expect the new uptrend in both to continue is that investors are still not interested in coming back into EEM. Here is a chart showing that fund’s number of shares outstanding.

When more people want to buy into an ETF, the sponsoring firm increases the number of shares outstanding to meet that demand, investing the proceeds in the underlying assets. That investor interest waxes and wanes in sympathy with what prices are doing. Thus far, there has been no increase in interest. At the point when shares outstanding data starts to show a dramatic and rapid rise, then one could say that uptrend is nearing an end. The message now is that it is still early in the new uptrend’s life cycle.
Tom McClellan
Editor, The McClellan Market Report
Aug 30, 2019
Crude Oil’s 10-Year Message |
Oct 10, 2019
Seasonal Inflection Point Has Moved Earlier |
Mar 28, 2019
Bond CEF A-D Line Showing Big Strength |