EMA or SMA: Which is Better?
Free Chart In Focus email
Delivered to you every week
Technical analysts like to put moving averages on their charts, and each analyst has his own favorite for the type of moving average and the speed at which it adjusts to changes in the data. The two most common types in use these days are Simple Moving Averages (SMAs) and Exponential Moving Averages (EMAs).
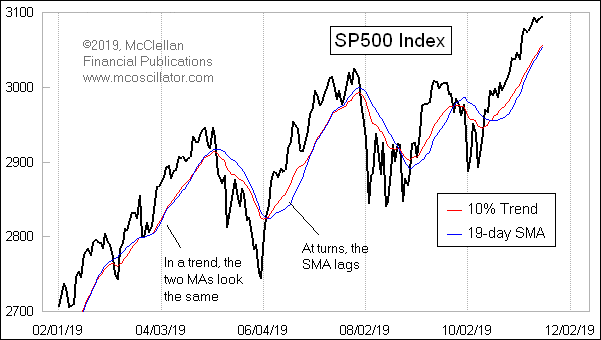
To understand why technicians care about EMAs versus SMAs, a quick look at this chart provides some an illustration of the difference. During trending moves upward or downward, a 10% Trend and a 19-day SMA will largely be right together. It is during periods when prices are choppy, or when the trend direction is changing, that we see the two start to move apart.
A SMA gathers all of the data in the lookback period, e.g. 10, 20, 50, 200 days, etc. and averages together all of the values with the same weighting. If you have a N-days moving average, then the oldest data at N+1 drops out of the calculation and gets replaced by the newest data each day. This keeps the SMA at the same number of days, and causes it to “move”, hence the name “moving average”.
An EMA is different in that it weights the most recent data more heavily. The EMA changes value each period based on how far the EMA is away from the price data, and based on a “smoothing constant” which determines how much of that difference gets made up each period. So for an EMA with a 10% smoothing constant, the EMA would move 10% of the distance between yesterday’s EMA value and today’s new price level.
I generally tend to prefer the use of EMAs in my own charting, although sometimes SMAs have their place. And I choose to refer to the EMAs according to an originalist view of how they should be labeled. Most technicians will refer to EMAs according to some number of days, but this is misleading. Old data never fully drop out of the calculation; they just become increasingly irrelevant to the calculation.
The late P.N. Haurlan was the analyst who first introduced the use of EMAs for tracking stock prices back in the 1960s. Haurlan was an actual rocket scientist who had worked at the Jet Propulsion Laboratory (JPL), and was among the first analysts ever to employ a computer for stock price analysis. He referred to EMAs according to their smoothing constants instead of some number of days of a lookback period, e.g. the “10% Trend” and “5% Trend” of the daily A-D difference which became part of the McClellan Oscillator which my parents developed.
The formula for converting an exponential moving average (EMA) smoothing constant to a number of days is:
2
———-
N + 1
where N is the number of days. Thus, a 19-day EMA would fit into the formula as follows:
2 2
————- = ———- = 0.10, or 10%
19 + 1 20
This stems from the idea that the smoothing constant is chosen so as to give the same average age of the data as would be had in a simple moving average. If you had a 20-period SMA, then the average age of each data input is 9.5. One might think that the average age should be 10, since that is half of 20, or 10.5 since that is the average of the numbers 1 through 20. But in statistical convention, the age of the most recent piece of data is 0. So finding the average age of the past twenty data points is done by finding the average of this series:
0, 1, 2, 3, ... 18, 19
So the average age of data in a set of N periods is:
N - 1
————
2
For exponential smoothing, with a smoothing constant of A, it turns out from the math of summation theory that the average age of the data is:
1 - A
————
A
Combining these two equations:
1 - A N - 1
——— = ————
A 2
we can solve for a value of A that equates an EMA to a simple moving average length as:
2
A = —————
N + 1
(I skipped a bunch of algebra steps there to save the reader some time).
So if one were to try to equate a 10% Trend to some number of days, you would solve for N and get 19 days. This week’s chart shows a comparison between a 10% Trend and a 19-day EMA, and it helps to make the case for why a lot of analysts prefer to use EMAs.
In a trending move, the two moving averages become almost identical. But at price turns is where we see the difference. In those cases, the 10% Trend will usually hug the price action more closely, and thus be in a better position to signal a change when the price crosses it. To many people, this property makes EMAs “better” than SMAs, but “better” is in the eye of the beholder.
The reason why engineers have used EMAs for years, especially in analog electronics, is that they are simpler to calculate. To determine today’s new EMA value, you only need yesterday’s EMA value, the smoothing constant, and today’s new closing price (or other datum). But to calculate a SMA, you have to know every value back in time for the whole lookback period.
Read more about the origins of Moving Averages.
You can read one of the original pieces ever written about this concept by going to McClellan_MTAaward.pdf. There, we feature an excerpt from P.N. Haurlan’s pamphlet, “Measuring Trend Values”.
Tom McClellan
Editor, The McClellan Market Report
Jul 08, 2011
Using the 10% Trend By Itself |
Feb 14, 2019
50 Years Since Creation of the McClellan Oscillator |
Aug 19, 2011
Death Cross Does Not Live Up To Its Hype |