Equity Options vs. Index Options

Free Chart In Focus email
Delivered to you every week
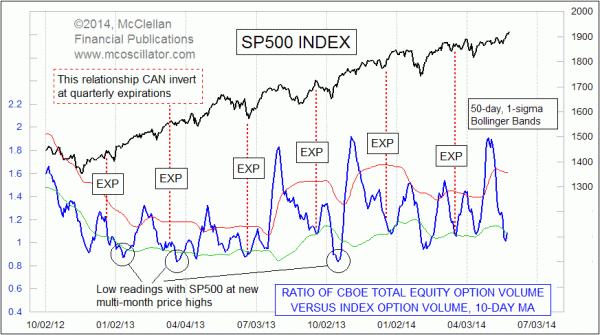
Most traders who look at options market data for market insights like to focus on the "Put/Call Volume Ratio", which examines the differences between the number of trades in bullish versus bearish bets. I use that data in my work, and even get into differences between the Put/Call Ratio for equity options versus index options.
There can also be useful information just in looking at the total volume in each category, which is what this week's chart does. It originated from a desire to know what it means when comparatively more of one category gets traded, and with a little bit of smoothing it makes for a nice indicator.
What we are looking at is a 10-day moving average of the daily ratio of total equity options volume versus index option volume as traded on the CBOE. It sums together the puts and the calls in each category. The range of values tends to wander a bit over time, and so I have also added 50-1 Bollinger Bands (50-day MA, and bands are set 1 standard deviation above and below). When this indicator goes up above the upper 50-1 band, it can indicate a topping condition for prices, and the opposite meaning comes from dips below the lower band.
The one huge caveat is that this indicator tends to work poorly around the time of quarterly options and futures expirations. The artificial volume related to exercising options and reestablishing positions can skew the numbers for a brief period. So that is an important factor to remember when using this indicator.
That is not a condition we face right now, as this indicator has just dipped below the lower band. It is an unusual condition to see the indicator this low while prices are making higher highs, but it has nevertheless happened before. The meaning is still bullish even at a higher price high. Some examples are highlighted.
The implication is that the breakout move in the SP500 should be able to continue higher because of the sentiment message revealed by this indicator.
Tom McClellan
Editor, The McClellan Market Report
Jan 11, 2013
The Disappearing Volume |
May 22, 2014
ETF Volume is Different |
Jan 02, 2014
VIX ETN Not Right For Investors |