ETF Volume is Different
Free Chart In Focus email
Delivered to you every week
Much has been written about using trading volume in technical analysis, and if you ever want a good primer on this, you should check out Buff Dormeier's book Investing With Volume Analysis. But what a lot of traders do not understand is that the rules are different for evaluating volume in ETFs.
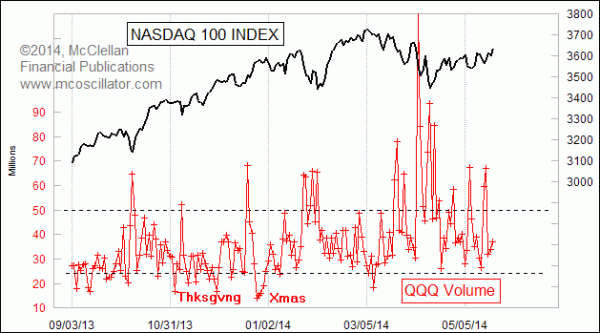
For several years, I have been using the daily volume in QQQ as a sentiment gauge, and it often gets featured in my Daily Edition. QQQ is the ETF which tracks the Nasdaq 100 Index, and I was introduced to this whole idea of examining its volume through the work of market sentiment expert Jason Goepfert. The whole idea is pretty simple: low QQQ volume is a sign of complacency, while high volume is a sign of panic, and thus of a price bottom.
This is different from how it works in the charts of individual stocks, where high volume on a breakout up day is a sign to confirm the breakout. And this is exactly the point I want to convey: anyone looking at ETF volume needs to put aside his understanding of how volume is supposed to "work" based on how it works in individual stock charts. The ETF market is just different.
In the chart above, I am portraying QQQ volume with a line plot rather than the bars which are the conventional way of displaying volume on a price chart. I have tried bars, and I find that I can just see things better this way. In recent months, a single day volume reading below around 25 million shares has been a good indication of complacency worthy of a short term top for prices. But one must be careful with low volume readings, because they can also be a sign of holiday light trading, such as what we see around Thanksgiving or Christmas.
High volume days above 50 million shares are much less equivocal. They make a statement that traders are panicky, and thus that a short term bottom for prices is likely. It works this way because in times of scarce liquidity, traders will eschew the individual stocks and prefer to invest in the more liquid broad market ETF. QQQ also gets used by traders as a shorting vehicle, to offload their overall portfolio risk without having to sell individual holdings, and so on a panicky down day when traders are thinking they need to hedge, they trade QQQ more for that purpose.
One caveat, however, is that if you see a high volume day in QQQ and the market does not stop going down, then that is a sign that the downtrend has more power to continue lower. This is very much an example of Martin Zweig's admonition that there is nothing more bearish than a failed bullish signal, and vice versa.
We saw a great example of that recently in late March 2014, when several high volume days could not hold back the tide of selling, and there was a more significant price decline. The really high spike on April 4, 2014 goes off the top of my chart, which is something I hate to do, but it does help make the point. That day was all the way up to 131 million shares, more than twice the threshold for marking a short term price bottom, and that day only stopped the decline temporarily. It took more work to get the selling climax finished.
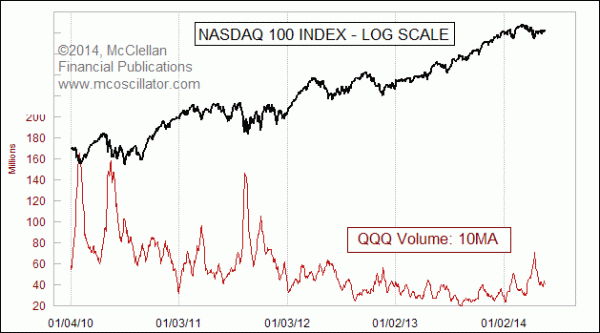
Aggregating several days' volume readings can also point to the more significant price bottoms. Here is a 10-day moving average of QQQ volume:
This same effect of high ETF volume marking price bottoms also works to some extend with SPY, the biggest of the ETFs which track the SP500 Index. Here is that chart:
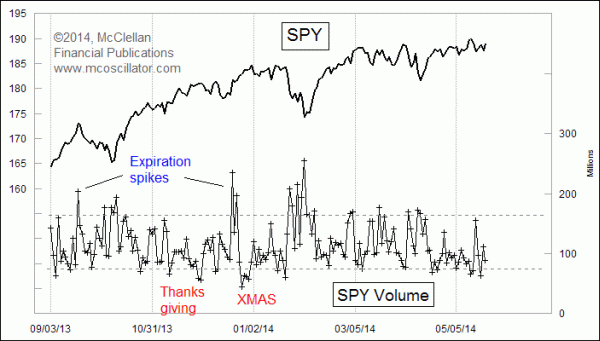
While the effect is still there, I find that the indications which SPY's volume can give are just not as good as the signs available in QQQ's volume. SPY volume also has one additional factor going against it, which is that on quarterly expirations of options and futures contracts, the volume tends to spike in SPY as the ETF is used as a vehicle for executing the unwinding of options positions. So in addition to ignoring the low volume readings on holidays, one must also learn to ignore the high volume readings which sometimes appear on expiration weeks.
As the Nasdaq 100 has started trending higher in May 2014, the high volume days are calming down now. But we have not yet seen a day with volume below 25 million, which suggests that trader sentiment is not yet at even a short term top-worthy condition.
Tom McClellan
Editor, The McClellan Market Report
Jan 27, 2012
Traders Like QQQ A Little Too Much |
Dec 02, 2011
Gold ETF Assets Show Bullish Sentiment |
Mar 06, 2014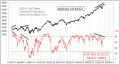
A Divergence Among Nasdaq 100 Stocks |