Crude Oil Says DJIA Should Trend Higher

Free Chart In Focus email
Delivered to you every week
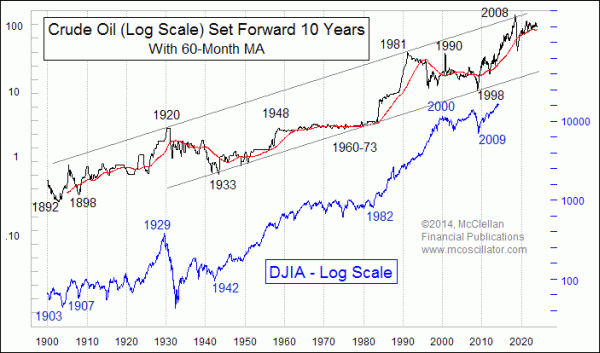
Four years ago I wrote about crude oil's 10-year leading indication for the movements of the DJIA. I expressed some doubt that it would continue to work, because it conflicted with the 40-year cycle analysis discussed here. But thanks to Fed QE and other factors, the pattern correlation has continued working, and so here we find ourselves in the middle of an uptrend just like oil's uptrend of 10 years ago.
I uncovered this leading indication relationship a few years ago when wondering about the long term relationship between stock prices and oil prices. I had put both price plots on a long term chart, but something seemed just a little bit off. When I tweaked the chart by shifting the oil price plot forward a little bit, it got better. With experimentation, I found that a 10 year offset produced the best pattern fit over the whole time period.
I do not have a good enough explanation for why the two should have this relationship, but after 120 years of data, I figure it is a solid enough phenomenon to trust somewhat, even if I cannot understand its basis. I don't understand gravity all the way either, but I accept it based on the overwhelming evidence.
Gravity seems a lot more constant and reliable than this relationship, which can get into trouble when outside forces put a thumb on the scale. The energy crisis of the 1970s was fed in part by the Arab Oil Embargo, and it produced a big up move for oil prices which was not replicated by the DJIA. The fall of the Shah of Iran in 1979 added its own surge, which the DJIA did not repeat literally, although 10 years later the stock market was indeed in a strong uptrend.
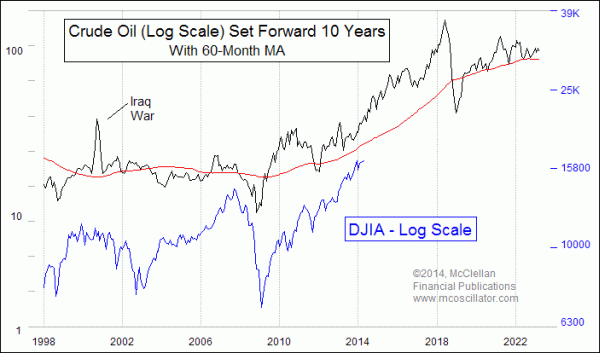
10 years ago in 2004, crude oil prices were engaged in a steady and exceedingly linear uptrend. The DJIA appears now to be replicating that action, thanks in part to the liquidity supplied by the Fed, and thanks also to investors' fading memories of the ugliness of the 2007-09 bear market.

Looking ahead, crude oil's price plot shows a continued upward trend for the next 3 years. Some trouble should appear after the inauguration of the next U.S. president in January 2017, but the uptrend should generally remain intact into 2018, which is when the trouble begins. That is also where the interpretational difficulty appears. 2008 saw a "rogue wave" in oil prices, as part of a commodities bubble which followed the real estate bubble top in 2006 and the stock market bubble top in 2007. So if we are to accept the message of crude oil from 10 years ago, should we really accept the message from a bubble period? Are we really going to have to see a 10-year echo of a rogue wave event?
That's a tough one, but it is an analytical problem we do not have to face for a few years. For now, the DJIA is trending upward just as crude oil in 2004 said should be happening now. We can worry about what to do in 2018 when it gets a bit closer.
Tom McClellan
Editor, The McClellan Market Report
Feb 26, 2010
Oil’s Leading Indication for Stocks |
Oct 12, 2012
40-year Cycle In DJIA |
Dec 10, 2010
After The Rogue Wave |