A Divergence Among Nasdaq 100 Stocks

Free Chart In Focus email
Delivered to you every week
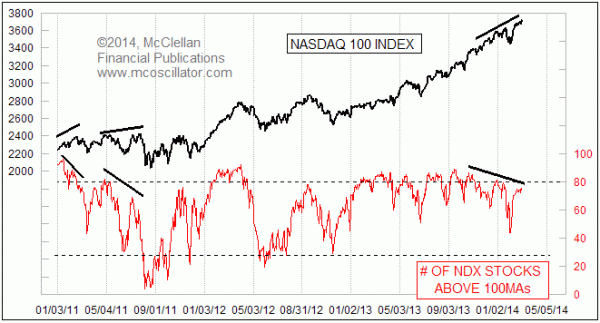
The Nasdaq 100 Index (NDX) has been leading the way higher, making higher highs and higher lows all throughout 2013 and into 2014. But it has been doing so with diminishing participation.
This week's chart shows an indicator whose value is featured every day in our Daily Edition. It measures the number of component stocks in the Nasdaq 100 Index which are above their 100-day simple moving averages. As the market advances, more stocks rise in sympathy and this indicator goes to higher values. Similarly when the market falls, the component stocks fall, and this indicator goes down. No surprise there.
The real information comes when there is a difference in behavior. Seeing the NDX make higher highs while fewer stocks are above their 100MAs is a sign of waning participation in the advance. But divergences can unfold over a long period of time before they finally matter and turn into a meaningful market decline.
That is the issue that we face right now. This indicator peaked all the way back in September 2013, and has been making a series of lower highs ever since even as the NDX has trended higher. History says that eventually this type of divergence is going to matter. But the market is inconsistent in terms of the period over which a divergence can last before the point when it "matters".
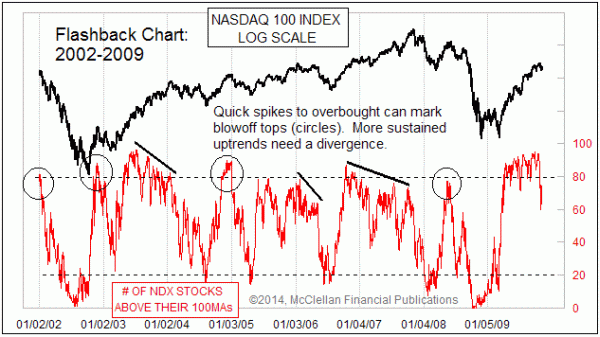
The chart below takes a longer look at this indicator:

Sometimes it can make a quick spike up to above 80 on a blowoff up move. Other times, the market continues going higher after a quick spike, and a long divergence is needed in order to build a top. The 2007 market top came at the end of a divergence that lasted 12 months. Patience can be difficult in such situations.
The current divergent condition is only 6 months old. But it carries the same attributes of other important divergences of the past, telling us that the uptrend is continuing on diminishing participation. Eventually it is going to matter.
Tom McClellan
Editor, The McClellan Market Report
Jan 01, 2010
Nasdaq A-D Line “Divergence” |
Jul 28, 2011
NDX Stocks Show Troubling Drawdowns |
Nov 21, 2013
Perhaps The Only Chart That Matters (For Now) |