Housing Stocks Due for a Dip

Free Chart In Focus email
Delivered to you every week
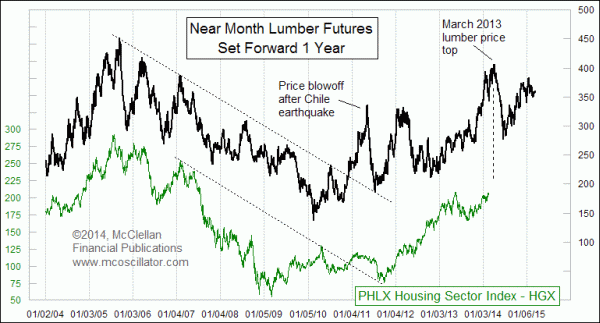
The rally in housing stocks that I wrote about last November has been proceeding pretty much according to plan. That's the good news. The bad news for investors is that lumber prices now say the housing related sector is due for a temporary dip.
Housing related stocks should see a recovery, for the most part, from that mid-year dip. But by the time that the bottom arrives, history suggests that no one will be believing in any recovery.
The key insight behind this forecast is a relationship I uncovered back in 2008. An interest in the movements of lumber prices led me to look at both the lumber market and the housing stocks sector. Upon initial examination, it was clear to me that there was somewhat of a coincident relationship, which would only make sense since the two are closely related. But the chart correlation was not quite right. I unlocked the secret by shifting forward the plot of lumber futures prices by a year, to reveal how the HGX Index tends to follow the same dance steps with about a one year lag.
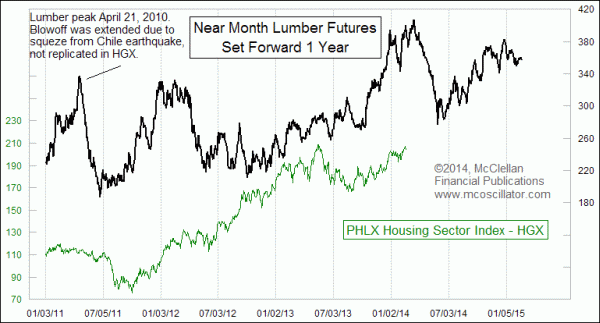
It is really nice to get the answers ahead of time, even if they are imperfect answers. And that imperfection is important to understand when using this relationship for insights. The chart below zooms in closer on this same relationship, and allows us to see that at an up-close level, the correlation is not as good as it was when we looked from further away.

Within this chart, we can see that back in 2011, the HGX did not feel compelled to follow the blowoff path of lumber prices a year earlier, when the April 2010 earthquake in Chile sent a tremor also through the lumber futures market. Since that price spike was the result of an exogenous event, and not a case of a push-pull of market forces, it did not see an echo in the prices of housing related stocks. And that reveals the key:
Lumber price movements do not "cause" the similar movements a year later in housing related stocks. Instead, lumber just serves as an indicator of an underlying "liquidity wave" flowing through the wood market, and that same wave generally shows up again a year later in the housing stocks market.
The chart also reveals that the HGX Index does not perfectly follow every bump and wiggle in lumber prices. And yet the overall correlation is evident. I take this to mean that it is a message worth listening to, but not one that is proper to expect perfection from. Life just does not work that way.
Coming up, the relationship says that a top lies just ahead of us, and then a strong-looking dip to a low due in June 2014. We saw similarly strong looking dips back in 2011 and 2012 that did not bring the same sort of magnitude response in the HGX Index, so that is worth understanding. Still, the timing of the movements was well matched even if the magnitude was not.
After that presumptive June 2014 bottom is another rally up toward the end of 2014. The corresponding rally in lumber prices did not make it to a higher high, but that does not necessarily mean that housing stocks cannot do so. Remember, this model is good for timing, not for magnitude.
Tom McClellan
Editor, The McClellan Market Report
Nov 07, 2013
Housing Stocks To Pop Up Into 2014 |
Feb 03, 2012
Eurodollar COT Indication Calls For Big Stock Market Top Now |
Oct 07, 2011
Lumber Contango Spells Economic Rebound |