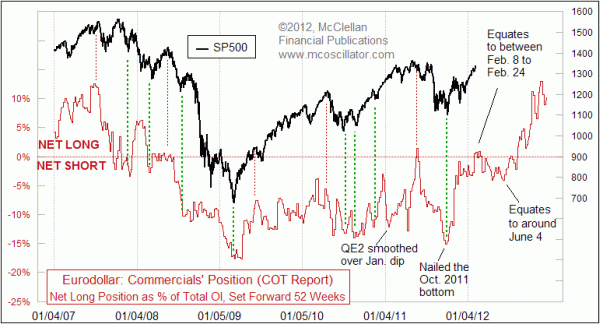
Eurodollar COT Indication Calls For Big Stock Market Top Now

Free Chart In Focus email
Delivered to you every week
Back in May 2011, I introduced Chart In Focus readers to the leading indication that I get from looking at Commitment of Traders (COT) data on eurodollar futures. Since then (and also before) readers of our twice monthly McClellan Market Report newsletter and Daily Edition have appreciated getting to see this relationship on a more frequent basis.
For almost a year, we have known that a top was due to arrive in February 2012. And sure enough, stock prices have been rising nicely in recent weeks as fulfillment of that expectation.
Now this leading indication says that things are going to get less fun for investors for a while. The next 3 months show a sideways to downward structure in the eurodollar COT data, and the implication is that the steep price advance that we have been seeing should transition to a more sideways market. That's great if one can be a swing trader, buying oversold opportunities and selling when prices get overbought, and then repeating. But it is a lousy time to be a buy and hold investor. How to play that chop is something that we will be sharing with our subscribers.
The next major inflection point is due in early June, when this leading indication says that a big multi-month rally is due to begin. By then, all of the bullishness that investors are expressing now in the various sentiment indications should have turned to frustration and pessimism, creating the right setup for a big new uptrend. The hard task will be to remain patient until then, waiting for conditions to be right again.
Tom McClellan
Editor, The McClellan Market Report
May 27, 2011
Commercial Traders Foretell Market’s Movements |
Jan 27, 2012
Traders Like QQQ A Little Too Much |
Oct 14, 2011
The Key To Watch For In November |