The Key To Watch For In November

Free Chart In Focus email
Delivered to you every week
Through August and September 2011, the stock market has gone through a meaningful correction. That resulted in a nice low reading for the McClellan A-D Summation Index. It was not as low of a reading as we saw during the ugliness of the 2008 selloff, but it was still low enough to mark a nice intermediate term oversold condition.
Now the question coming out of this oversold reading is over whether we will see enough strength to signal initiation of a strong new uptrend.
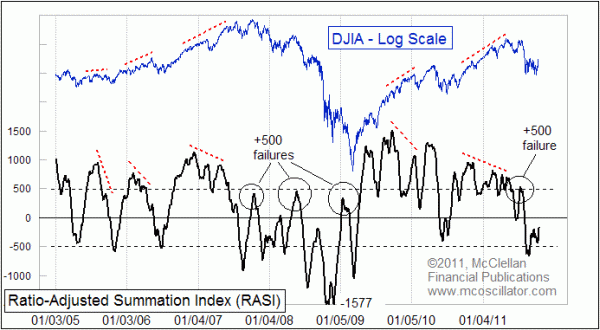
This week's chart shows the Ratio-Adjusted Summation Index (RASI). It is calculated using the same math that is used for the classic version of the Summation Index, except that for the data input we divide the daily Advance-Decline (A-D) difference by the sum of Advances plus Declines. We also then multiply that ratio by 1000 just to take the product back up into the realm of real numbers. In effect, we are mathematically pretending that there are always exactly 1000 stocks traded every day, which factors out changes in the numbers of issues traded, and makes for better long term comparisons.
Coming out of an intermediate or long term correction, the key indication to look for is whether or not the RASI can climb back up above +500. It is kind of like when a rocket takes off to get up into earth orbit. It has to achieve a certain speed, referred to as escape velocity, or else it will fall back down to earth. Market rebounds work similarly, in that there needs to be a certain amount of strength showing up in the A-D numbers at the beginning of an uptrend, or else prices roll over and head back down to the level of the prior low, or even lower.
So what we will want to see in the weeks ahead is a RASI move back up above the +500 level, which equates to around +2500 on the classic version of the Summation Index. That is something that we will be watching for and discussing in the upcoming issues of our twice monthly newsletter and Daily Edition.
If it fails to get up above +500, and instead rolls back over and heads downward at or below the +500 threshold, that will be a sign that there is not sufficient liquidity to keep the rally going, and the August to October 2011 lows will get revisited or exceeded.
Tom McClellan
Editor, The McClellan Market Report
Aug 26, 2011
Large Absolute Breadth Numbers |
Jul 01, 2011
A Breadth Thrust Signal |
Oct 01, 2010
RASI or Classic - Which Summation Is Better? |
Jul 16, 2010
Start Point for Summation Index Does Not Matter |